
 Home
Home News
News
- Polygon’s active addresses crossed the mark of 15 billion last month.
- The token outperformed ETH and SOL by registering a 71% raise in the NFT sales volume.
- The holders sense an approaching downtrend.
The internet of blockchains, Polygon’s founder Sandeep Nailwal recently tweeted about the infrastructure’s active addresses crossing 15 billion. Also, MATIC outperformed ETH and SOL by rising by 71% in the NFT sale volume. Data from DeFiLlama revealed that Polygon’s TVL marked an uptick and amounted to $1.49 billion. But unfortunately, the charts did not reflect the same zeal in the other aspects of the project.

Here’s what the charts tell
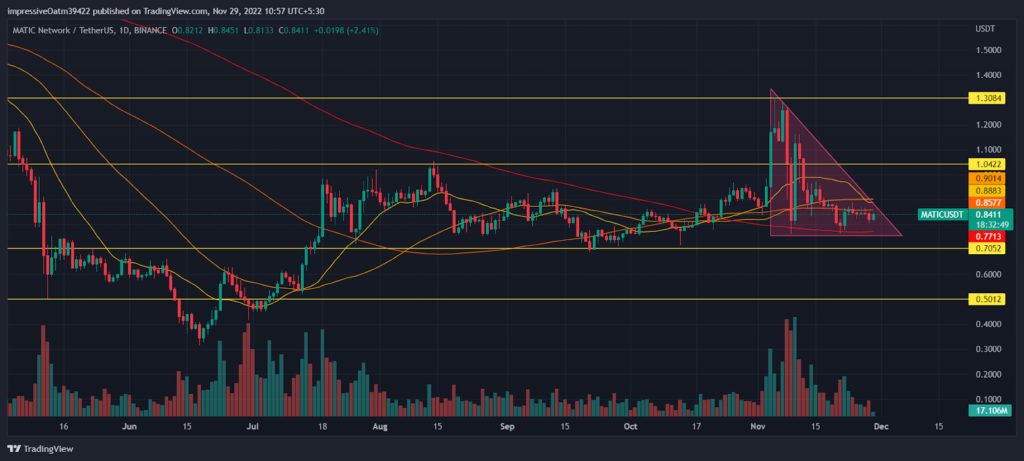
The price levels are seen forming a descending triangle pairing with diminishing trading volumes. The price levels also cross the EMA ribbon displaying slightly bearish signals, which may increase the chances of a continued downtrend. The price aims to fall closer to $0.5 respecting the previous swing and maintaining the downtrend.

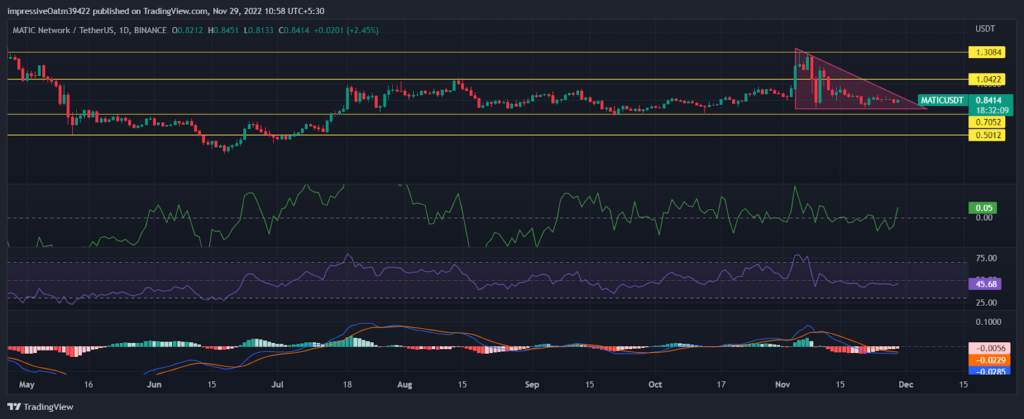
The CMF indicator rises as the price forms the triangle to the level slightly above the 0-mark. It may retrace to the zone below this level and continue to form the to and fro movement. The RSI indicator lays below the neutral mark and moves horizontally. The MACD indicator turns bullish and functions below the zero level. It may turn back neutral by tangling and moving akin to the 0-mark level.
In the recent hours
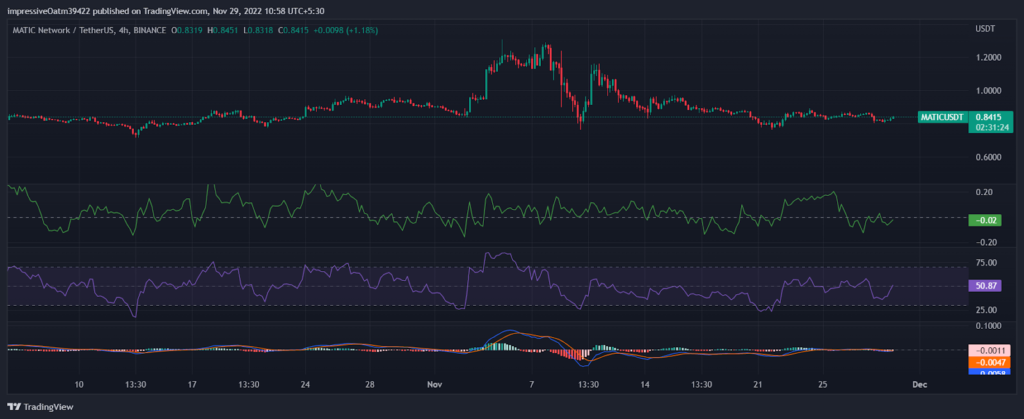
The price continues at the same pace and pattern. The MACD indicator entwined and coincided with the 0-mark with slivers of trading. The CMF indicator moves below the base point but slopes slightly upwards, forming the to-and-fro movement. The RSI indicator dips steeply and retraces to the neutral zone at 50-mark. It may not cross the neutral line and oscillate within the same region.
Conclusion
The market of Polygon shows all glitters with non-monetary aspects but goes all dull with the price levels, as the prices show a down trend and sharp falls in the future. Slight ups and downs are not a great eye-catcher and need something solid to attract holders’ attention.
Technical levels
Support levels: $0.70 and $0.50
Resistance levels: $1.04 and $1.30
Disclaimer
The views and opinions stated by the author, or any people named in this article, are for informational ideas only, and they do not establish financial, investment, or other advice. Investing in or trading crypto assets comes with a risk of financial loss.
Steve Anderson is an Australian crypto enthusiast. He is a specialist in management and trading for over 5 years. Steve has worked as a crypto trader, he loves learning about decentralisation, understanding the true potential of the blockchain.


