
 Home
Home News
News
- Filecoin price prediction suggests the consolidation phase of FIL inside the symmetrical triangle pattern over the daily price chart.
- FIL crypto is trading at 20 EMA but still below 20, 50, 100 and 200-days Daily Moving Average.
- The pair of FIL/BTC is at 0.0002595 BTC with an intraday drop of 3.73%.
The Filecoin price prediction points to the token being confined inside the symmetrical triangle pattern over the daily price chart. The FIL cryptocurrency needs to escape its current circumstance in order to rise over the daily price chart. The token must wait until it leaves the consolidation state and breaks free of the symmetrical triangular pattern in its recovery phase before the FIL army may attack. Over the course of the daily price chart, the price of Filecoin went through an exciting roller coaster, initially failing to escape the symmetrical triangular pattern and getting stuck in the consolidation stage. The token was able to escape the consolidation phase after recovering, but it was quickly drawn back into the falling triangle pattern.
The current estimated price of Filecoin is $4.36, and over the last day, it has lost 4.71% of its market value. The volume of trades during the intraday trading session has increased by 15%. This suggests that people who are selling SHIB cryptocurrency are attempting to withdraw the token.
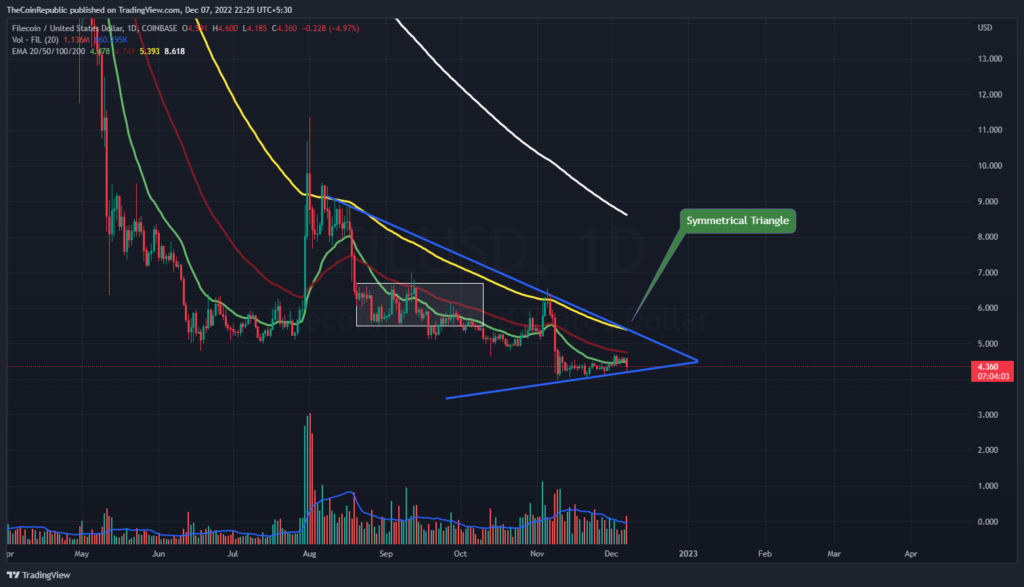
The price of Filecoin has been falling throughout the daily price chart through a symmetrical triangular pattern. The daily chart for the FIL cryptocurrency displays a fantastic roller coaster ride. FIL needs to increase the volume change, which is currently below average and needs to be increased, in order to break out of the symmetrical triangle pattern. FIL crypto is trading at 20 EMA but still below 20, 50, 100 and 200-days Daily Moving Average.
What do Technical Indicators suggest about FIL?
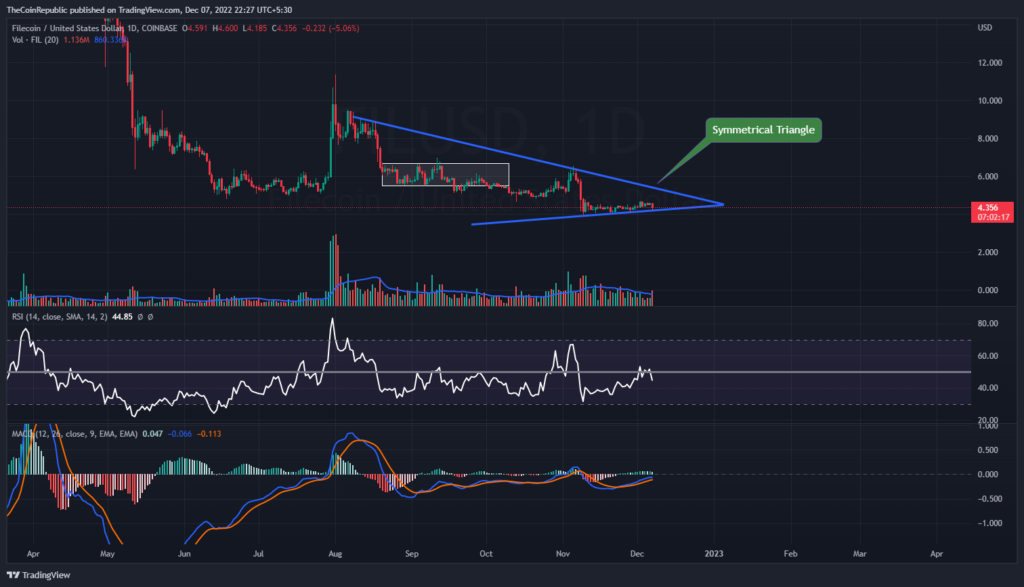
In order for the token to commence its recovery phase, the price of Filecoin needs to break out of the symmetrical triangular formation, and more buyers need to enter the market during intraday trading. Technical indicators support the token’s drop over the course of the daily price chart.
The Relative Strength Index shows the downward momentum of the SHIB cryptocurrency. At 44, the RSI is below neutrality. In MACD, the SHIB’s downward velocity is apparent. Investors in FIL must keep an eye out for any noticeable momentum differences in the price movement of the token.
Conclusion
The Filecoin price prediction points to the token being confined inside the symmetrical triangle pattern over the daily price chart. The FIL cryptocurrency needs to escape its current circumstance in order to rise over the daily price chart. The token must wait until it leaves the consolidation state and breaks free of the symmetrical triangular pattern in its recovery phase before the FIL army may attack. FIL needs to increase the volume change, which is currently below average and needs to be increased, in order to break out of the symmetrical triangle pattern. Technical indicators support the token’s drop over the course of the daily price chart.
Technical Levels
Support Levels: $4.12 and $3.95
Resistance Levels: $4.75 and $5.75
Disclaimer
The views and opinions stated by the author, or any people named in this article, are for informational ideas only, and they do not establish the financial, investment, or other advice. Investing in or trading crypto assets comes with a risk of financial loss.
Steve Anderson is an Australian crypto enthusiast. He is a specialist in management and trading for over 5 years. Steve has worked as a crypto trader, he loves learning about decentralisation, understanding the true potential of the blockchain.


