
 Home
Home News
News
- XMR is now peeking to scratch the $150 round level.
- The coin now consecutively constructs higher highs and transitions the upside momentum.
Monero coin is now looking to win over the overwhelming bears, which are maintaining their grips near the price of $150. XMR bulls are nowadays assembling their muscles and gaining momentum with a rise in volume. The last three sessions are fully controlled by bulls, as the price recovers by 7%, and sellers are now in fear. In the previous month, XMR made a low of $118, rebounded from the bottom and continued to trade in the rising channel pattern. The channel formation leads the price to cross the near-term hurdle.
Moreover, the XMR coin is trading in the upper Bollinger band and looking to escape the hurdle of $150. The digital asset is now trading further its 20, 50 and 100 days EMA and looking to test the 200 days EMA, which is priced at $156.
Daily Chart shows bulls streak
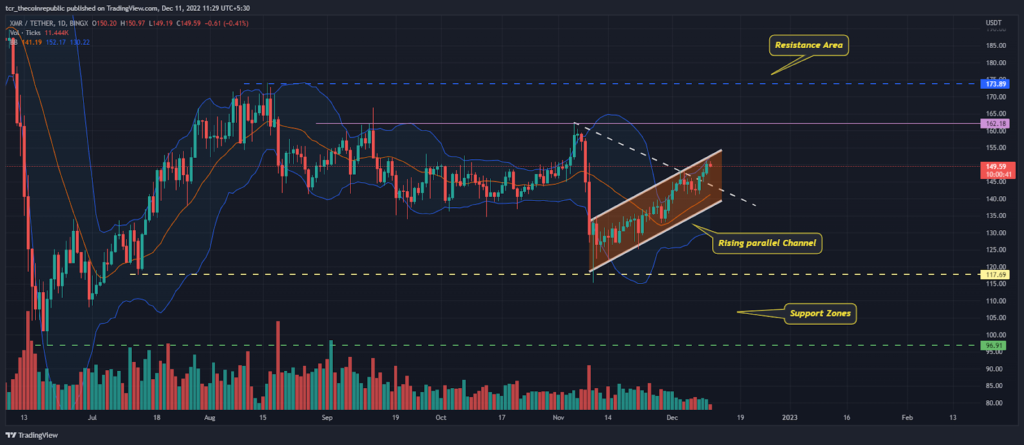
On the daily chart, the XMR coin is crafting assertive moves as the bulls surpass the trendline at $146 and are now targeting its eyes over $150. Despite the bullishness, if the coin fails to crack the resistance mark, then the rising wedge pattern shapes, and if the price breaks the lower range of $145, further weakness can be seen.
However, the channel trajectory shows the near-term targets of $155, and if bulls sustain over there and positionally, $170 is the strong resistance area.
As per the Fib retracement, XMR crosses the middle range decisively, and the strong fence is at $152 and $164, whereas the immediate support range is at $145 and $138.
Short term chart shows Ascending triangle pattern formation
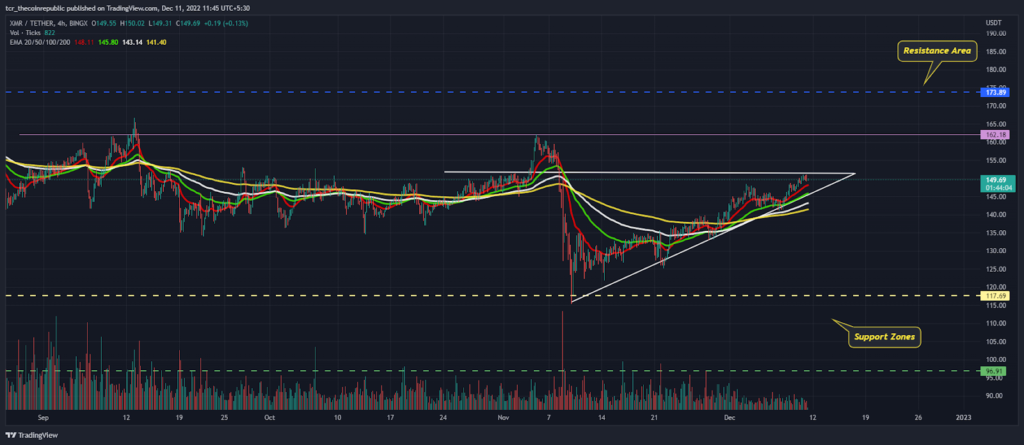
On the 4-hour chart, the XMR coin makes the ascending triangle pattern, and its neckline is at $150. A rally can be seen if the coin succeeds in escaping the range, leading the price to $160. At the time of writing, XMR price is trading at $149.66 with slightly shifting gains of 0.455. The ADX also bounced back from the bottom of 15, and now it is also at 23, indicating the building up of trend strength.
What RSI and MACD says?
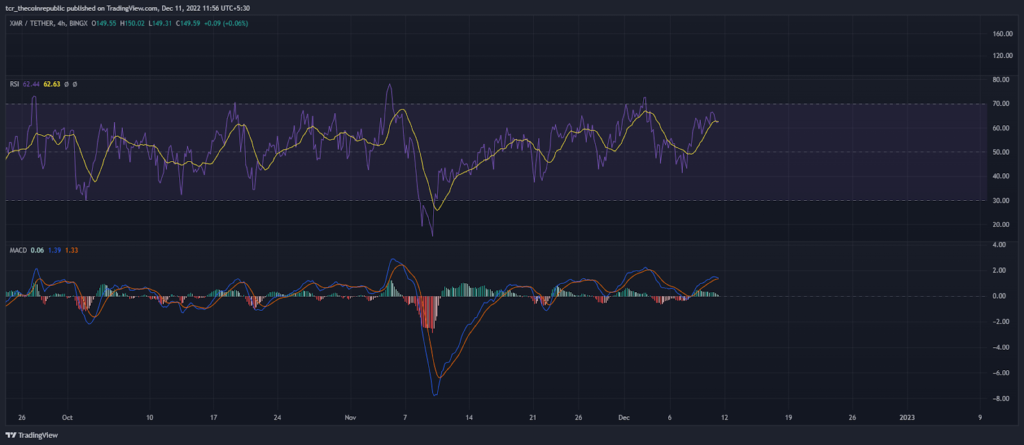
RSI ( Bullish): The RSI is now in the buying territory of 62 and showing that the price is in the range of bullishness. The signal line is near the MA line, making it uncomfortable for investors for fresh longs.
MACD( Bullish): The MACD also suggests bullishness as the crossover was caught in the previous week, leading to the gains and maintaining the histogram with greenery.
Conclusion:
Monero Price predicts the hope of breaking the range of $150. If it happens, prices will rally upwards with a target of $160. If it reverses from the resistance zone, then $145 is to be retested in the upcoming sessions.
Technical Levels:
Support Levels:$140 and $132
Resistance Levels:$152 and $163
Disclaimer
The views and opinions stated by the author, or any people named in this article, are for informational ideas only, and they do not establish financial, investment, or other advice. Investing in or trading crypto assets comes with a risk of financial loss.

With a background in journalism, Ritika Sharma has worked with many reputed media firms focusing on general news such as politics and crime. She joined The Coin Republic as a reporter for crypto, and found a great passion for cryptocurrency, Web3, NFTs and other digital assets. She spends a lot of time researching and delving deeper into these concepts around the clock, and is a strong advocate for women in STEM.


