
 Home
Home News
News
- Zcash price prediction suggests that the tone is trying to sustain at the neckline of an ascending triangle pattern over the daily price chart.
- ZEC crypto is trading at 20 and 50 EMA but is still below 100 and 200-days Daily Moving Average.
- The pair of ZEC/BTC is at 0.002694 BTC with an intraday gain of 0.68%.
Zcash price prediction suggests the consolidation phase of the toke inside the ascending triangle pattern over the daily price chart. ZEC coin needs to sustain at the neckline of the ascending triangle pattern over the daily price chart. ZEC investors need to wait for the token to surge above the neckline at $47.00. ZEC bulls need to accumulate buyers for the token to escape the triangle pattern. However, volume change is not upto the mark and needs to grow for ZEC to sustain at the verge of the ascending triangle pattern.
Yesterday, ZEC’s market value dropped by 0.06%, and its anticipated price is $45.9. However, trade volume increased by 35% during the intraday trading session. This implies that buyers are making an effort to buck the current UNI crypto trend.
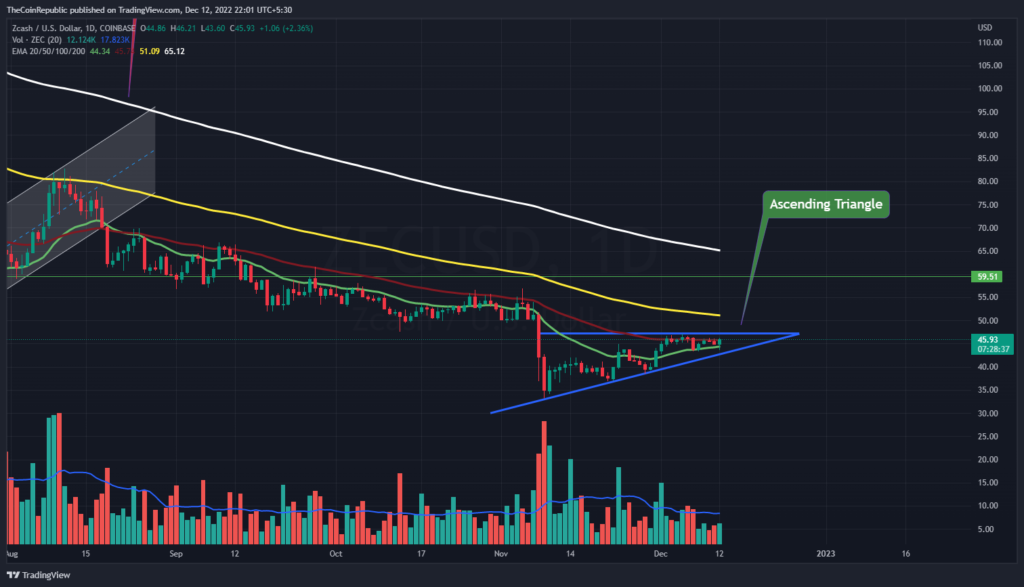
Zcash price prediction confirms the consolidation phase of ZEC cryptocurrency inside the triangle pattern over the daily price chart. Meanwhile, ZEC crypto is trading at 20 and 50 EMA but is still below 100 and 200-days Daily Moving Average as directed on the daily price chart. However, volume change can be seen below average and needs to grow for ZEC to break out of the ascending triangle pattern.
Will Zcash Price Register its Breakout?
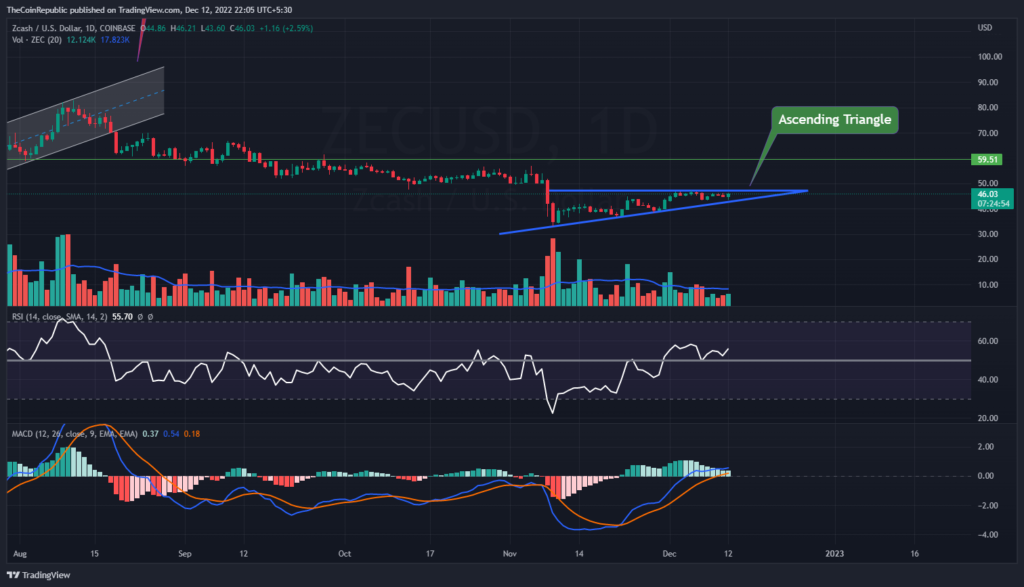
The rising momentum of the token over the daily price chart is indicated by the ZEC price projection. Technical indicators support the ZEC cryptocurrency’s current ascent. The ZEC cryptocurrency’s upward momentum is displayed by the Relative Strength Index. At 55, the RSI is edging closer to the overbought zone. The MACD shows that ZEC cryptocurrency is gaining momentum. After a positive crossover, the MACD line is significantly in front of the signal line. Market manipulation by sellers could cause the token to drop out of the overbought region.
Conclusion
Zcash price prediction suggests the consolidation phase of the toke inside the ascending triangle pattern over the daily price chart. ZEC coin needs to sustain at the neckline of the ascending triangle pattern over the daily price chart. ZEC investors need to wait for the token to surge above the neckline at $47.00. However, volume change can be seen below average and needs to grow for ZEC to break out of the ascending triangle pattern. After a positive crossover, the MACD line is significantly in front of the signal line. Market manipulation by sellers could cause the token to drop out of the overbought region.
Technical Levels
Support Levels: $44.00 and $40.00
Resistance Levels: $47.00 and $50.00
Disclaimer
The views and opinions stated by the author, or any people named in this article, are for informational ideas only, and they do not establish the financial, investment, or other advice. Investing in or trading crypto assets comes with a risk of financial loss.

Nancy J. Allen is a crypto enthusiast, with a major in macroeconomics and minor in business statistics. She believes that cryptocurrencies inspire people to be their own banks, and step aside from traditional monetary exchange systems. She is also intrigued by blockchain technology and its functioning. She frequently researches, and posts content on the top altcoins, their theoretical working principles and technical price predictions.


