
 Home
Home News
News
- Cosmos price prediction suggests the consolidation phase of the cryptocurrency inside the symmetrical triangle pattern over the daily price chart.
- ATOM crypto is currently trading below 20, 50, 100 and 200-days Daily Moving Average.
- The pair of ATOM/BTC is at 0.0005434 BTC with an intraday drop of 1.80%.
Cosmos price prediction indicates the token’s consolidation phase inside the symmetrical triangle pattern. ATOM crypto needs to acquire more buyers in order to surge towards the upper trendline of the symmetrical triangle pattern over the daily price chart. However, ATOM has been a great investment of the cryptocurrency traders and currently ATOM investors have been waiting for the token to recover above $10.00 level. Bulls need to come forward for the token to break out from the symmetrical triangle pattern over the daily price chart. Meanwhile, Utilities of ATOM cryptocurrency like it is used as a span prevention mechanism, as a staking token and voting advantage, just added up pudding to the cake.
Cosmos‘ price is currently approximated at $9.61 and has lost 2.42% of its market capitalization in the last 24-hour period. Trading volume has dropped by 12% during the intraday trading session. This indicates that sellers are trying for a pullback. Volume to market cap ratio is 0.04778.
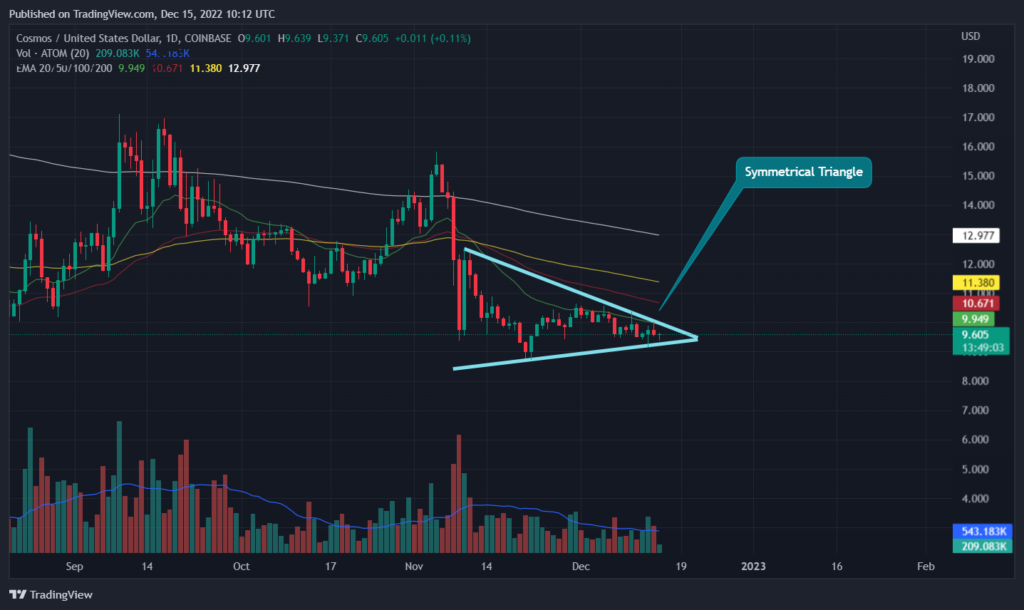
Cosmos price prediction suggests the token’s struggle to break out from the symmetrical triangle pattern over the daily chart. However, volume change can be seen below average and needs to grow for ATOM to surge towards the upper trendline of the symmetrical triangle. Meanwhile, ATOM crypto is currently trading below 20, 50, 100 and 200-days Daily Moving Average. ATOM needs to attract more buyers during the intraday trading session for the token to surge out of the triangle pattern.
Observe Closely to the Technical Indicators for Cosmos Price!
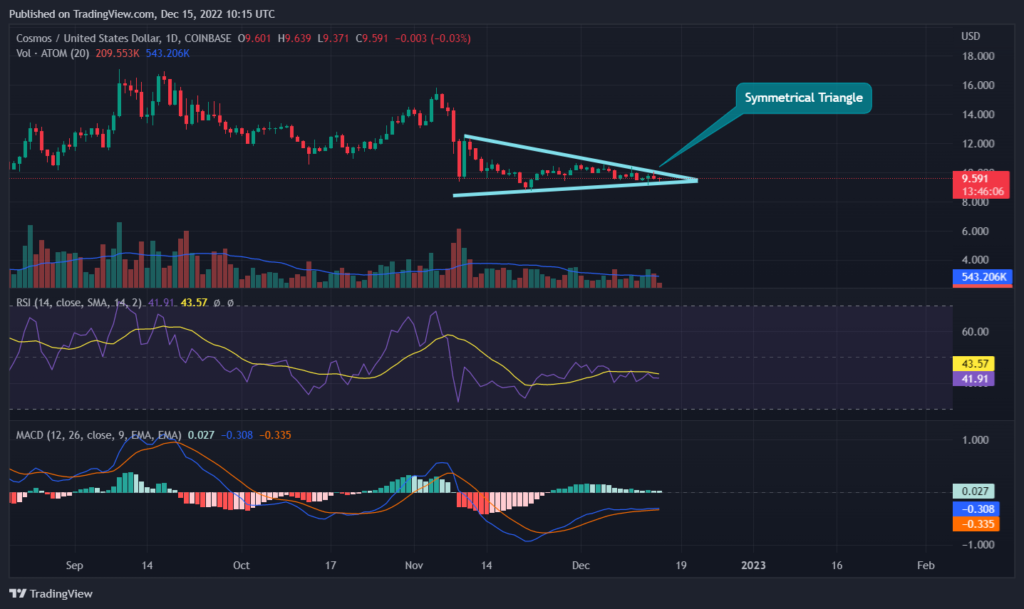
Cosmos price needs to attract more buyers for the token to adapt either of the trends over the daily price chart. Technical indicators suggest the sideways momentum of ATOM cryptocurrency.
Relative Strength Index showcases the sideways momentum of ATOM crypto. RSI is at 43 and is flat below neutrality. MACD exhibits the consolidation phase of ATOM inside the symmetrical triangle pattern. The MACD line is overlapping the signal line and is waiting for anytype of crossover. ATOM investors need to wait for any directional change over the daily price chart.
Conclusion
Cosmos price prediction indicates the token’s consolidation phase inside the symmetrical triangle pattern. ATOM crypto needs to acquire more buyers in order to surge towards the upper trendline of the symmetrical triangle pattern over the daily price chart. However, ATOM has been a great investment of the cryptocurrency traders and currently ATOM investors have been waiting for the token to recover above $10.00 level. However, volume change can be seen below average and needs to grow for ATOM to surge towards the upper trendline of the symmetrical triangle. The MACD line is overlapping the signal line and is waiting for anytype of crossover.
Technical Levels
Support Levels: $9.15 and $8.75
Resistance Levels: $10.50 and $12.00
Disclaimer
The views and opinions stated by the author, or any people named in this article, are for informational ideas only, and they do not establish financial, investment, or other advice. Investing in or trading crypto assets comes with a risk of financial loss.

Nancy J. Allen is a crypto enthusiast, with a major in macroeconomics and minor in business statistics. She believes that cryptocurrencies inspire people to be their own banks, and step aside from traditional monetary exchange systems. She is also intrigued by blockchain technology and its functioning. She frequently researches, and posts content on the top altcoins, their theoretical working principles and technical price predictions.


