
 Home
Home News
News

- Tron price prediction showcases the justifiable rate of recovery of the token through a rising parallel channel over the daily price chart.
- TRX crypto has recovered till 20 and 50 EMA but is till below 100 and 200-days Daily Moving Average.
- The pair of TRX/BTC is at 0.000003136 BTC with an intraday gain of 2.02%.
Tron price prediction suggests the token’s recovery through the inclining parallel channel over the daily price chart. TRX crypto needs to maintain its recovery rate as it nears the lower price limit of the priori consolidation phase over the daily price chart. The consolidation phase ranged between $0.060 and $0.065. The token is currently trying to surge inside an ascending parallel channel as it approaches the neckline it repels as the trend reverses from the upper trendline of the parallel channel. TRX investors need to continue the uptrend momentum in order to attain the recovery inside the consolidation phase over the daily price chart.

Tron price is currently approximated at $0.0555 and has gained 1.21% of its market capitalization in the last 24-hour period. Trading volume has increased by 12.53% during the intraday trading session. This demonstrates that buyers are trying to accumulate themselves for the token to surge towards the upper price range of the ascending parallel channel over the daily chart.

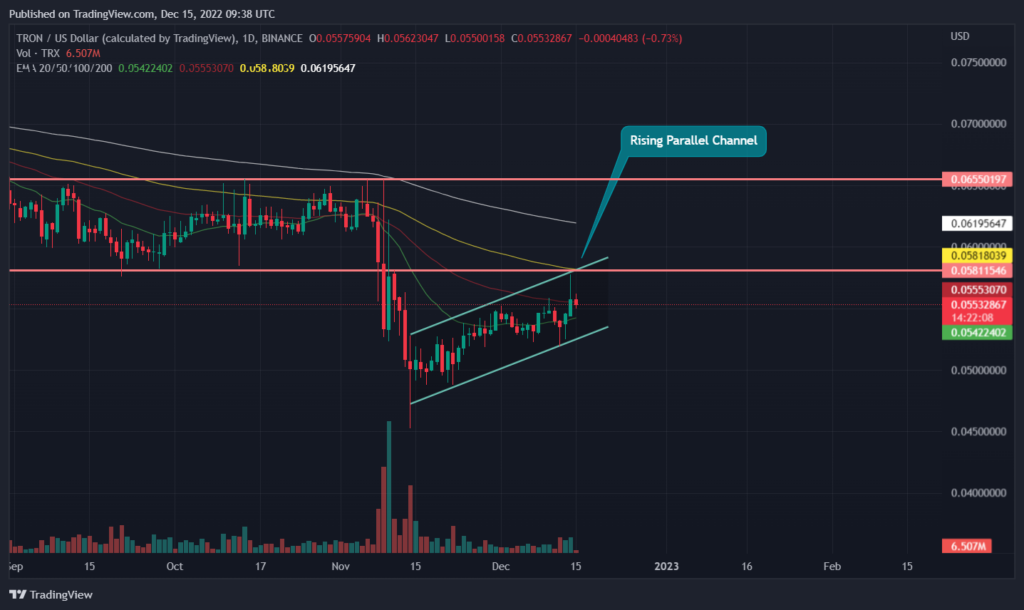
Tron price prediction indicates that the token is trying to recover over the daily price chart. TRX crypto needs to increase the rate of accumulation for the token to surge over the chart. However, volume change can be seen below average and needs to grow for TRX to recover. Meanwhile, TRX crypto has recovered till 20 and 50 EMA but is till below 100 and 200-days Daily Moving Average.
Will Justin Sun’s Tron (Tron Price) Survive this Uncertain Pump and Dumps?
Justin Sun’s Stablecoin USDD falls to the lowest levels and it worries the TRX investors. However, TRX cryptocurrency is trying to manage itself and fighting for its existence over the daily price chart. Meanwhile, technical indicators suggest the slow and steady recovery rate of TRX cryptocurrency.
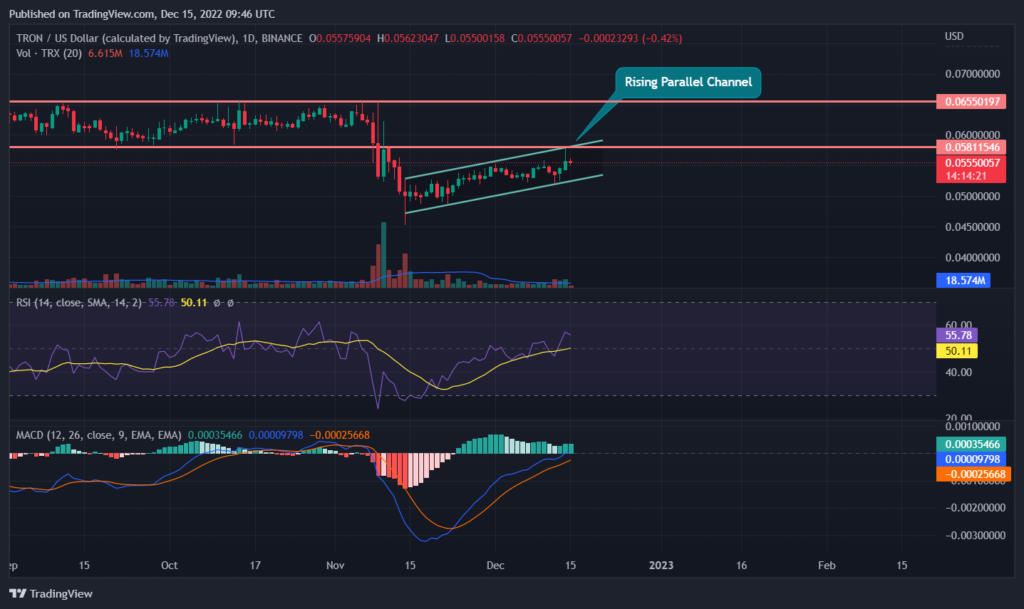
Relative Strength Index showcases the uptrend momentum of TRX coin. RSI is at 55 and is maintaining itself above neutrality. MACD exhibits the recovery rate of the TRX cryptocurrency over the daily price chart. The MACD line is ahead of the signal line after positive crossover and is currently above 0 in the positive zone. TRX investors need to wait for any directional change over the daily price chart.
Conclusion
Tron price prediction suggests the token’s recovery through the inclining parallel channel over the daily price chart. TRX crypto needs to maintain its recovery rate as it nears the lower price limit of the priori consolidation phase over the daily price chart. However, volume change can be seen below average and needs to grow for TRX to recover. Meanwhile, technical indicators suggest the slow and steady recovery rate of TRX cryptocurrency. The MACD line is ahead of the signal line after positive crossover and is currently above 0 in the positive zone.
Technical Levels
Support Levels: $0.052 and $0.050
Resistance Levels: $0.058 and $0.060
Disclaimer
The views and opinions stated by the author, or any people named in this article, are for informational ideas only, and they do not establish financial, investment, or other advice. Investing in or trading crypto assets comes with a risk of financial loss.

Andrew is a blockchain developer who developed his interest in cryptocurrencies while pursuing his post-graduation major in blockchain development. He is a keen observer of details and shares his passion for writing, along with coding. His backend knowledge about blockchain helps him give a unique perspective to his writing skills, and a reliable craft at explaining the concepts such as blockchain programming, languages and token minting. He also frequently shares technical details and performance indicators of ICOs and IDOs.


