
 Home
Home News
News
- BRC Inc stock price prediction indicates that the price of the asset is trying to maintain in the recovery phase over the daily time frame.
- Black Rifle Coffee Company’s stock is believed to be a conjectural investment stock as it is currently trying to be stable in the current market scenario.
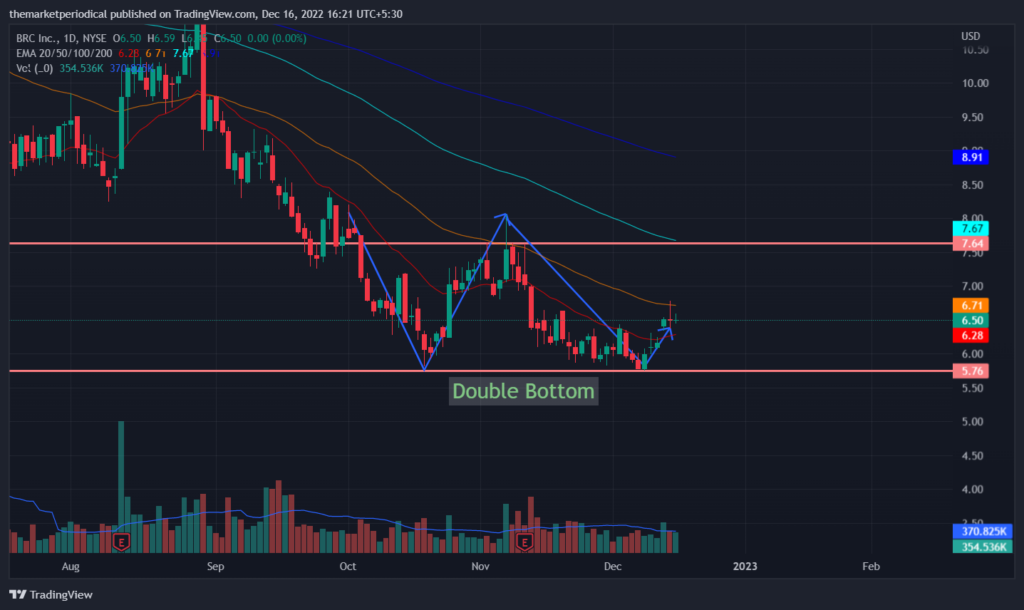
- BRCC stock price has just returned from a lower level by making a double bottom pattern over daily time frame.
BRCC Stock price needs to maintain its current uptrend momentum to rally upwards over the daily price chart. However, at first BRC Inc Stock price tested the support zone of $5.75 in October and then surged till the upper trendline or the distribution phase at $7.65 level. After getting distributed BRCC stock price has slipped again again to retest the $5.75 support level or we can say the accumulation phase making a double bottom pattern over the daily chart. BRCC Stock price prediction showcases the double bottom pattern carved by the price action over the daily price chart.
BRCC Stock price is currently estimated at $6.50 by the closing of the day’s trading session. Now BRCC investors need to wait for the upcoming trading session to open and see if buyers are getting attached in the trade to continue the current rally or else sellers try for a pullback.
BRCC Stock price prediction indicates the recovery phase of the stock price inside the consolidation phase over the daily price chart. BRCC Stock price needs to keep up the pace and the accumulation rate for the token to surge over the daily chart.
Meanwhile, volume change can be seen below average and needs to grow for BRC stock price to continue its rally towards the upper trendline at $7.65. However, BRCC Stock price is currently trading above 20 EMA but is still behind 50, 100 and 200-days Daily Moving Average.
Will BRCC Stock Price Manage to Save this Recovery Curve?
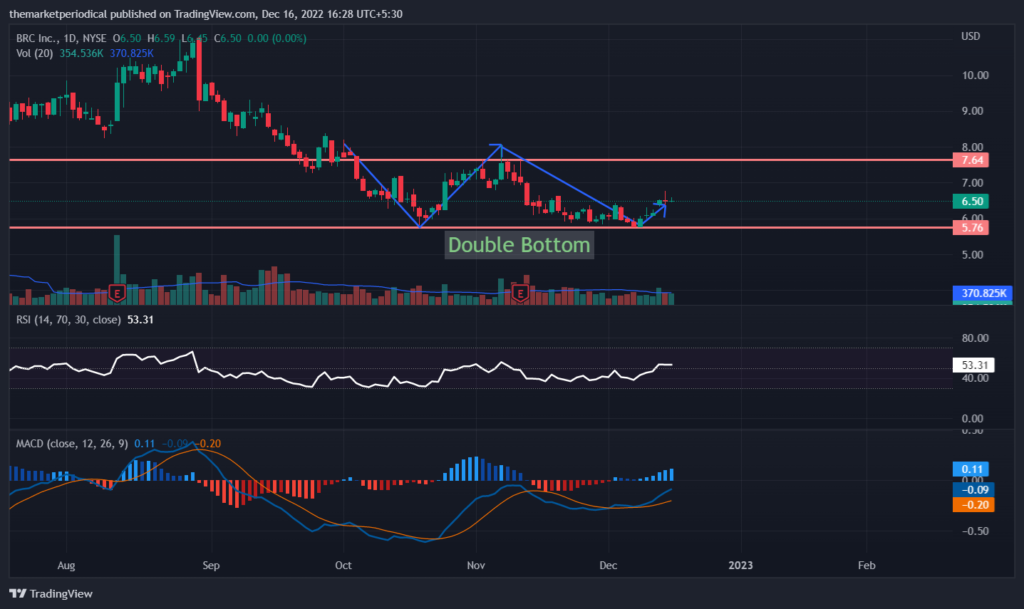
Technical indicators suggest that BRCC Stock price needs to maintain the current recovery rate over the daily price chart. Relative Strength Index showcases the consolidation of BRCC stock price inside the consolidation phase. RSI is at 53 and is flat above neutrality. MACD exhibits the uptrend momentum of BRCC Stock price. The MACD line is above the signal line after a positive crossover. Investors in BRCC need to show some patience as the asset is trying to surge towards the upper price range of the consolidation phase.
Conclusion
After getting distributed BRCC stock price has slipped again again to retest the $5.75 support level or we can say the accumulation phase making a double bottom pattern over the daily chart. BRCC Stock price prediction showcases the double bottom pattern carved by the price action over the daily price chart. BRCC Stock price needs to keep up the pace and the accumulation rate for the token to surge over the daily chart. V
Technical Levels
Support Levels: $6.00 and $5.75
Resistance Levels: $6.80 and $7.65
Disclaimer
The views and opinions stated by the author, or any people named in this article, are for informational ideas only, and they do not establish financial, investment, or other advice. Investing in or trading crypto assets comes with a risk of financial loss.

Nancy J. Allen is a crypto enthusiast, with a major in macroeconomics and minor in business statistics. She believes that cryptocurrencies inspire people to be their own banks, and step aside from traditional monetary exchange systems. She is also intrigued by blockchain technology and its functioning. She frequently researches, and posts content on the top altcoins, their theoretical working principles and technical price predictions.


