
 Home
Home News
News
- XRP slipped below Volume profile’s point of control and approaching value area low
- Lower lows candle formation, but volume keeps on declining and RSI at 38 may enter oversold zone, whereas MACD generated negative crossover
XRP is trading with bearish cues as the uncertainty in SEC vs Ripple regulatory is still affecting the sentiments of investors. As per coinglass, The XRP/USDT long buildup is stood at 44.78% and short buildup is stood at 55.22% indicates more players are expecting prices to remain weak. As of now XRP is down by 4.24% in the last 24 hours.
Will XRP bounce back from Value are Low
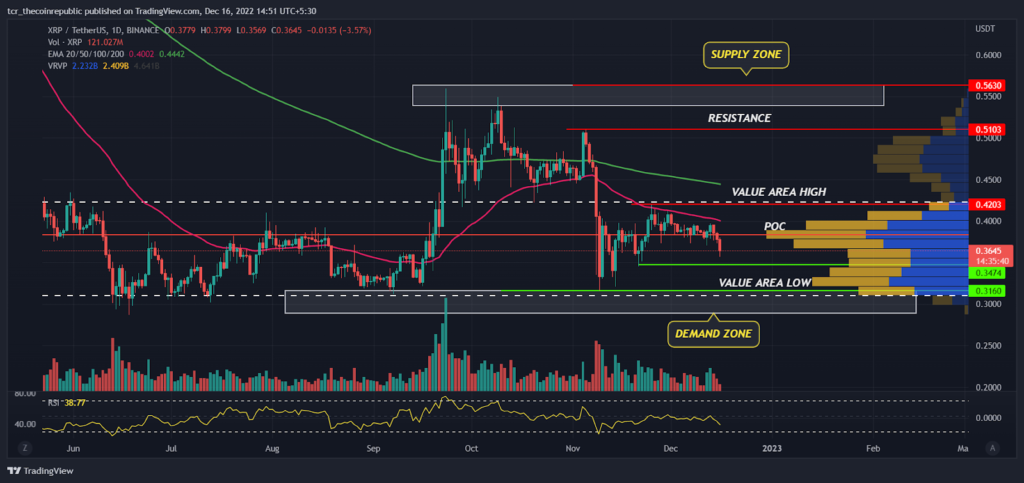
On a higher time frame XRP had been very stable as compared to other cryptos. From past couple of months it has been trading in the range between $0.3160 to $0.4203 later in the end of september prices had breakout the higher range and rallied almost 30% and reaches $0.5500 but unfortunately due to FTX collapse prices unable to sustain higher levels and bears drag the prices back to its previous support zones.
As per volume profile analysis, prices have slipped below point of control(POC) and are approaching Value Area Low which will act as important support zones in coming days. The 200 day ema(green) sloping sideways indicates the trend may reverse upside if bulls succeed to trade above Value Area High. The 50 day ema (pink) at 0.4000 sloping down will act as immediate resistance for bulls followed by next hurdle will be $0.402 and $0.5103
The closer window
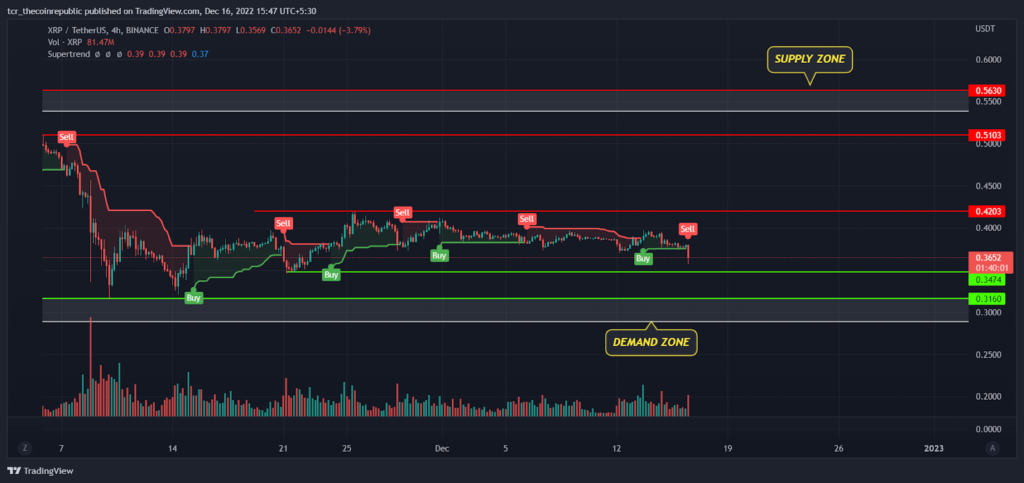
On a smaller time frame, XRP prices are sandwiched in the range between $0.3474 to $ 0.4203 and likely to break on either side in coming weeks. The super trend indicator had generated a fresh sell signal indicating the short term trend may remain weak, however it’s risky to create short positions near the support zones but conservative Investors may use the current decline to accumulate XRP at lower levels.
MACD
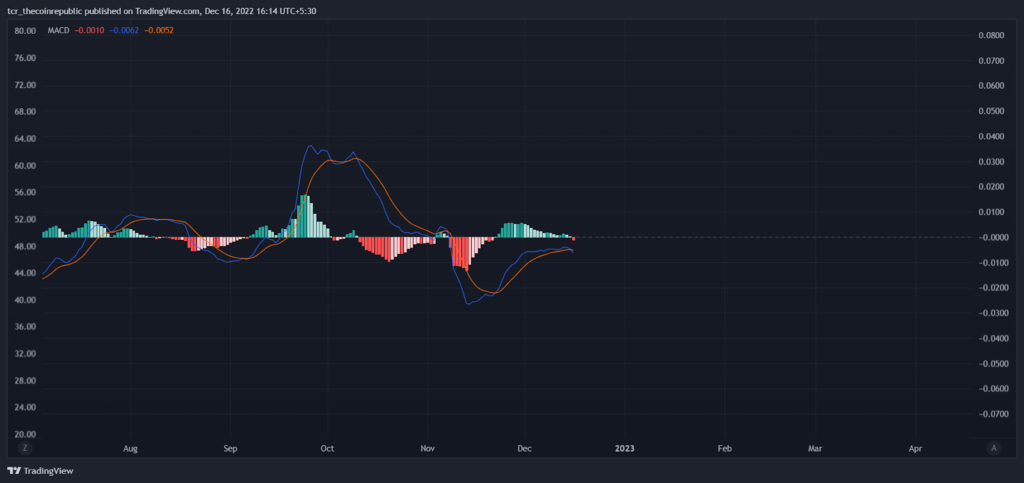
MACD had been mildly bullish in the past couple of days but green histogram bars kept on declining shows strength getting diminished. Presently, MACD is again on a way to generate negative crossover and price and witness selling pressure on higher levels.
Summary
XRP had been trading with bearish cues due to uncertainty in SEC vs Ripple regulatory issues. Well after analyzing the XRP in multiple timeframes the prices may witness some selling pressure from the higher levels and expected to trade in the range for coming weeks. Aggressive traders should avoid creating any buying opportunity at lower levels but if bulls succeed to trade above $0.4203 XRP may witness short term trend reversal.
Technical levels
Resistance levels : $0.4203 and $0.5103
Support levels : $0.3160 and $0.2884
Disclaimer
The views and opinions stated by the author, or any people named in this article, are for informational ideas only, and they do not establish financial, investment, or other advice. Investing in or trading crypto assets comes with a risk of financial loss.

Andrew is a blockchain developer who developed his interest in cryptocurrencies while pursuing his post-graduation major in blockchain development. He is a keen observer of details and shares his passion for writing, along with coding. His backend knowledge about blockchain helps him give a unique perspective to his writing skills, and a reliable craft at explaining the concepts such as blockchain programming, languages and token minting. He also frequently shares technical details and performance indicators of ICOs and IDOs.


