- Amazon stock price has been falling below a downward sloping line over the daily price chart.
- AMZN stock price has slipped below 20, 50, 100 and 200-days Daily Moving Average.
- Amazon stock has dropped more than 50% year to date.
Amazon stock price has been falling since August 2022 and has been dropping below a downward sloping line over the daily price chart. AMZN stock (NASDAQ: AMZN) needs to accumulate buyers in order to reverse the current downtrend momentum. However, technical indicators forecast some hard times for AMZN stock by this week. However, AMZN stock price may surge if backlashes from layoffs get cooler and investors keep their confidence high over AMZN shares. Meanwhile, AMZN is about to be oversold during the intraday trading sessions. Sellers are gripping tightly and now is the time for bulls to charge for AMZN share price to surge back above $85.
Amazon stock price is currently estimated at $83.04 and has lost 4.29% of its market capitalization in the last 24-hour period. However, trading volume needs to be incensed burning the day’s trading session.
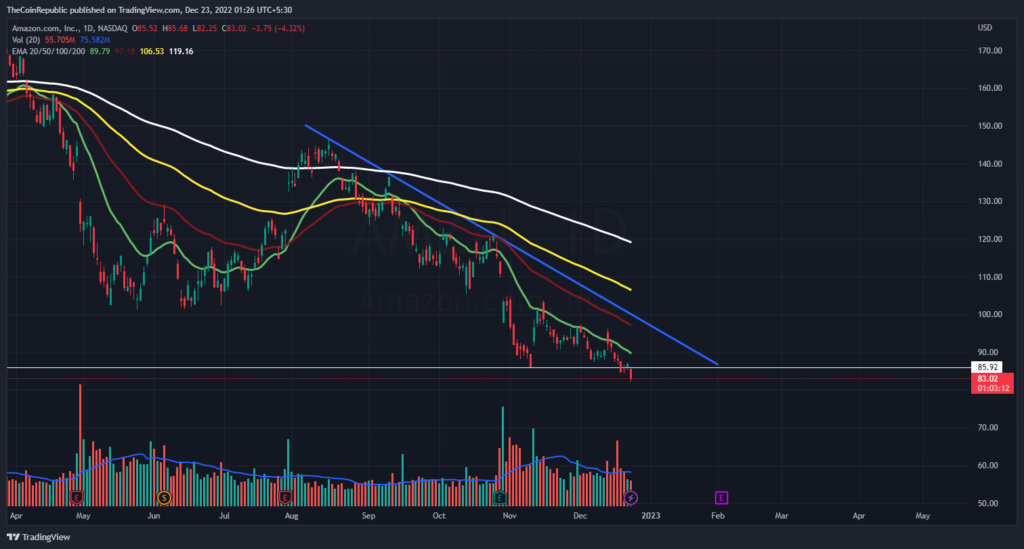
AMZN stock price needs to sustain at the current level to retrace the trend over the daily price chart. However, Volume which shows the accumulation rate is below average and needs to grow in favor of bulls for AMZN share price to be reversed. Amazon stock price has slipped till 2020 lows and is now faltering to gain support from buyers. Now the demand zone for AMZN stock price is situated at $81.00 and it may get reversed from the demand zone.
Can Amazon stock be saved from being Oversold?
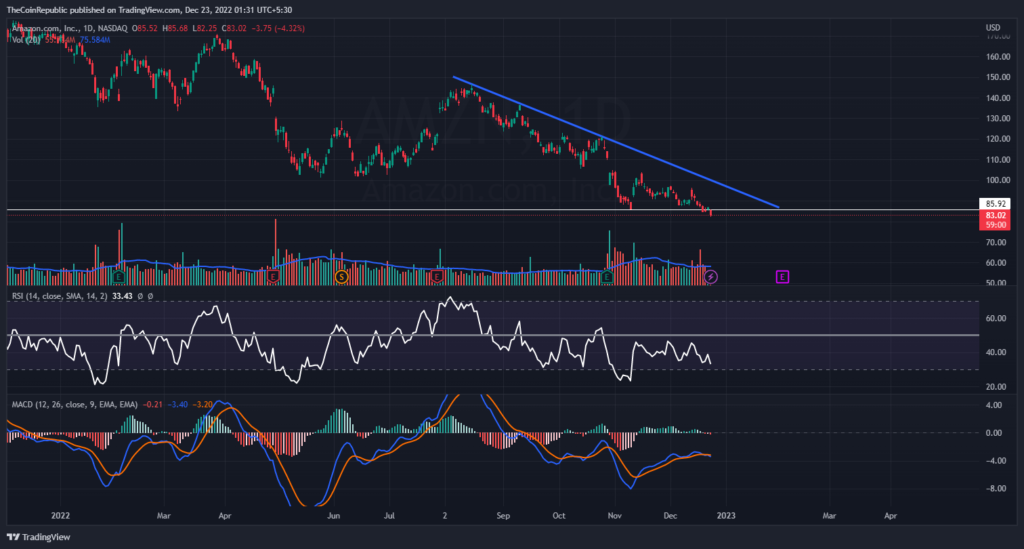
AMZN share price has been slipping below a downward sloping line over the daily price chart. Technical indicators showcase that AMZN share price can be oversold at any moment during the day’s trading session.
Relative Strength Index showcases the downward velocity of AMZN stock price. RSI is at 33 and is heading towards the oversold territory. MACD exhibits the downtrend momentum of AMZN stock. The MACD line is below the signal line after a negative crossover. MACD forecasts that AMZN share price may continue to be in this bearish rally until it gets its demand fulfilled in the demand zone at $81.00. Amazon stock investors need to wait for any directional change over the daily price chart.
Summary
Amazon share price has been falling since August 2022 and has been dropping below a downward sloping line over the daily price chart. AMZN stock (NASDAQ: AMZN) needs to accumulate buyers in order to reverse the current downtrend momentum. Amazon stock price has slipped till 2020 lows and is now faltering to gain support from buyers. Technical indicators showcase that AMZN share price can be oversold at any moment during the day’s trading session. MACD forecasts that AMZN share price may continue to be in this bearish rally until it gets its demand fulfilled in the demand zone at $81.00.
Technical Levels
Support Levels: $81.00 and $80.00
Resistance Levels: $87.00 and $95.00