
 Home
Home News
News
- UNI formed bullish engulfing candle from its demand zone at $5 and may approach 50 day ema soon
- MACD had generated negative crossover whereas RSI at 41 sloping sideways indicates sellers lacked momentum on lower levels.
Uniswap price is trading with mild bullish cues and buyers are trying to defend its recent lows at $5. As per coin glass, In the last 12 hours Longs are 49.5% and shorts are 50.5% indicates equal level of tug of war between buyers and sellers. Currently, UNI/USD is trading at $5.328 with the intraday gains of 0.21% and 24 hour volume to market ratio stood at 0.0102
Will UNI bounce back from its demand zone ?
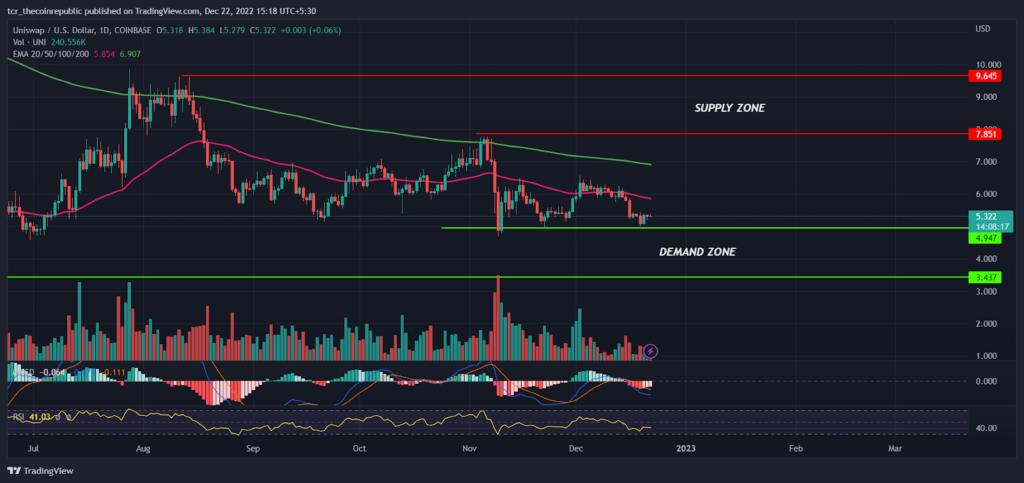
On a day time frame, Uniswap price had been quite stable and trading near its important demand zone at $5.00. Despite a bearish crypto market in 2022, UNI had been sustaining its 6 months low indicating confidence of buyers in lower levels. In the month of July, bulls gained some positive momentum and tried to trade above 200 day ema (green) but unable to sustain higher levels and sellers took control over the prices and dragged it down below 50 day ema. Later prices took support at $5 and traded in the range between $5 to $8 which is likely to break either side soon.
The 50 day ema (green) pink at $5.855 will act as an immediate hurdle for bulls followed by the next hurdle will be 200 day ema. The MACD has generated negative crossover which may trigger the bearish sentiment in coming days whereas the RSI at 41 reversing upwards may provide support to the bullish investors.
Bullish trend reversal possible ?
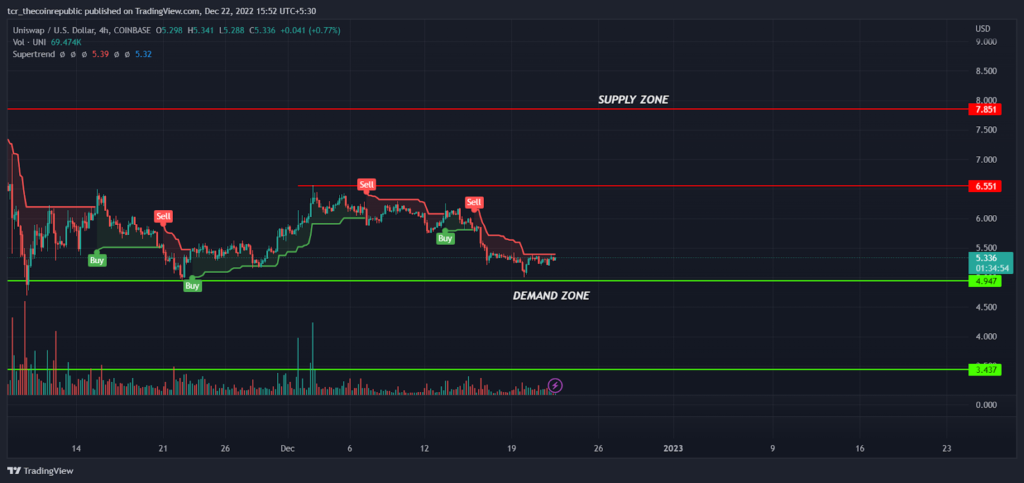
On a lower time frame, Uniswap had been consolidating in the tight range between $5.000 to $6.551 and likely to see expansion on either side soon. In the past couple of weeks supertrend have turned bullish when prices came near to support zone of $5 which indicates responsive buyers are active in the lower levels. Recently, The super trend indicator had generated sell signal from the higher zone and continuing trailing down indicates bear dominance but as of now prices are trading near the demand zone and if bulls succeed to trade above $6.00 we may see some short term trend reversal.
Summary
Uniswap had been trading near its 6 months low support zone and responsive buyers had succeeded to push the price higher forming a bullish engulfing pattern but as of now technical indicators had not shown any signs of trend reversal. So, aggressive traders might take the risk to buy uniswap at current levels for the target of $6.00 and above by keeping $4.50 as SL and If prices slipped below $5 we may see further downside towards $3.437
Technical levels
Resistance levels : $6.551 and $7.851
Support levels : $5.000 and $3.437
Disclaimer
The views and opinions stated by the author, or any people named in this article, are for informational ideas only, and they do not establish financial, investment, or other advice. Investing in or trading crypto assets comes with a risk of financial loss.

Andrew is a blockchain developer who developed his interest in cryptocurrencies while pursuing his post-graduation major in blockchain development. He is a keen observer of details and shares his passion for writing, along with coding. His backend knowledge about blockchain helps him give a unique perspective to his writing skills, and a reliable craft at explaining the concepts such as blockchain programming, languages and token minting. He also frequently shares technical details and performance indicators of ICOs and IDOs.


