
 Home
Home News
News
- APE is trading near the demand zone of $3.00 and likely to bounce back from the lower levels.
- MACD had generated negative crossover whereas the RSI at 44 may enter oversold level in coming days.
APE Price is trading with the mild bearish cues and bears have succeeded to drag the prices down below 50 day ema indicates sellers are active on higher levels. As per Coin glass, In the last 12 hours Longs were 42.92% and Shorts were 56.08% indicating bearishness may continue in coming days. Currently, APE/USDT is trading at $3.562 with the intraday loss of 0.17% and 24 hour volume to market ratio stood at 0.0577
APE forming a base in its demand zone at $3 ?
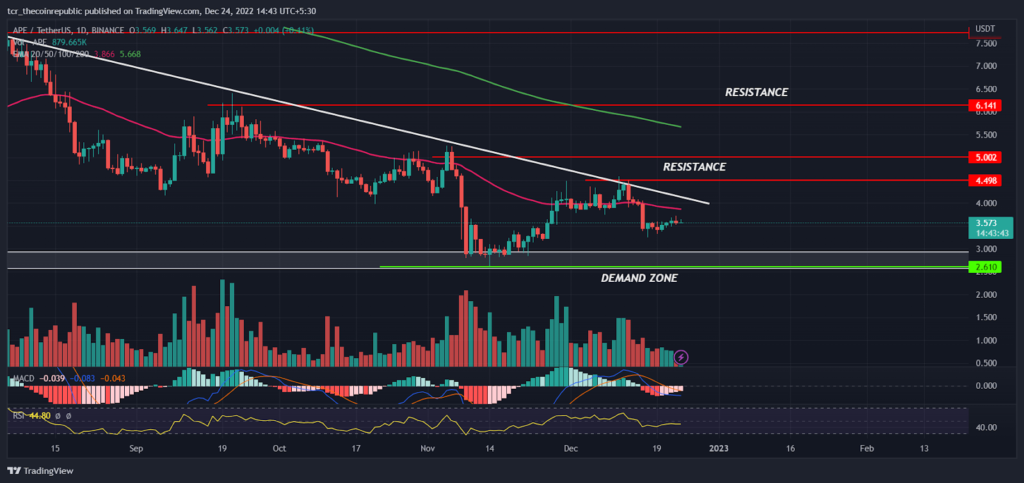
On a daily time frame, APE Price looks in a downtrend and struggling to reclaim its 50 day ema (pink) at $3.867 while the bulls are able to defend $3.00 support and keep the prices stable. In September, APE took support at $4 and gave some positive upside swings but it resulted as a bull trap and selling got triggered from the resistance zone of $6.00 and hit a low at $2.610. Later, after a little bit of consolidation prices were slow and steadily on rise.
The 200 day ema (green) sloping down indicates a trend to remain weak on a positional basis and the 50 day ema (pink) at $3.867 will act as an immediate hurdle for bulls followed by next at $5.002. The MACD had generated negative crossover indicating prices may stay mild bearish whereas the RSI at 44 sloping sideways denotes prices may witness a relief rally soon.
Is Upside Trend reversal possible ?
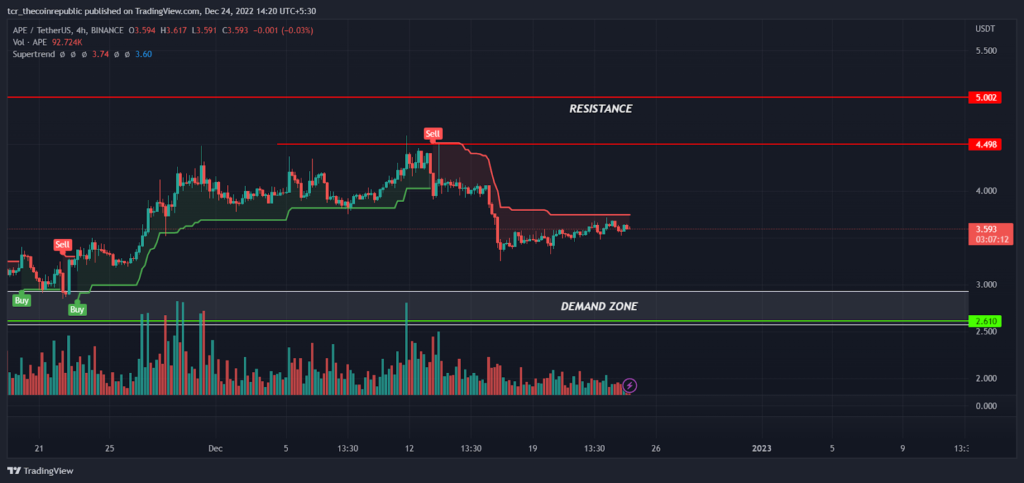
On a lower time frame, APE prices are slow and steady rise with a low momentum. In the past couple of weeks, The supertrend indicator generated a buy signal from the support zone of $3 and pushed the price higher towards $4.50 indicating responsive buyers are active on lower levels. Recently, The supertrend had reversed downside and generated a sell signal from the resistance level of $4.50 indicating the short term trend may remain in bear grip, but if bulls succeed to trade above $4.50 we may see a bullish trend reversal in coming weeks.
Summary
APE Price is struggling to regain its bullish momentum but the 50 day ema is acting as a strong barrier for bulls. As per technical analysis, prices were mild bearish and likely to trade sideways. As of now, prices were consolidating near the demand zone so it’s better to avoid creating fresh short positions. However, The Aggressive traders might look for buying opportunities at near the demand at $3 for the target of $5.00 and above by keeping $2.610 as SL
Technical levels
Resistance levels : $5.000 and $6.141
Support levels : $3.000 and $2.610
Disclaimer
The views and opinions stated by the author, or any people named in this article, are for informational ideas only, and they do not establish financial, investment, or other advice. Investing in or trading crypto assets comes with a risk of financial loss.

Nancy J. Allen is a crypto enthusiast, with a major in macroeconomics and minor in business statistics. She believes that cryptocurrencies inspire people to be their own banks, and step aside from traditional monetary exchange systems. She is also intrigued by blockchain technology and its functioning. She frequently researches, and posts content on the top altcoins, their theoretical working principles and technical price predictions.


