
 Home
Home News
News
- ApeCoin price is taking a turn for the worse when the weekly candle is down around 10%.
- Buyers barely keep APE crypto above the 200 moving line of the EMA ribbon indicator.
- The APE related to the bitcoin pair is up 2.78%, reported at 0.0002313 satoshis.
Due to the retracement phase of lower prices in the crypto market, many altcoins saw a decline. Thus ApeCoin also slid down, with the price trading at $3.92 against USDT at the time of writing.
ApeCoin on 4 Hour Chart
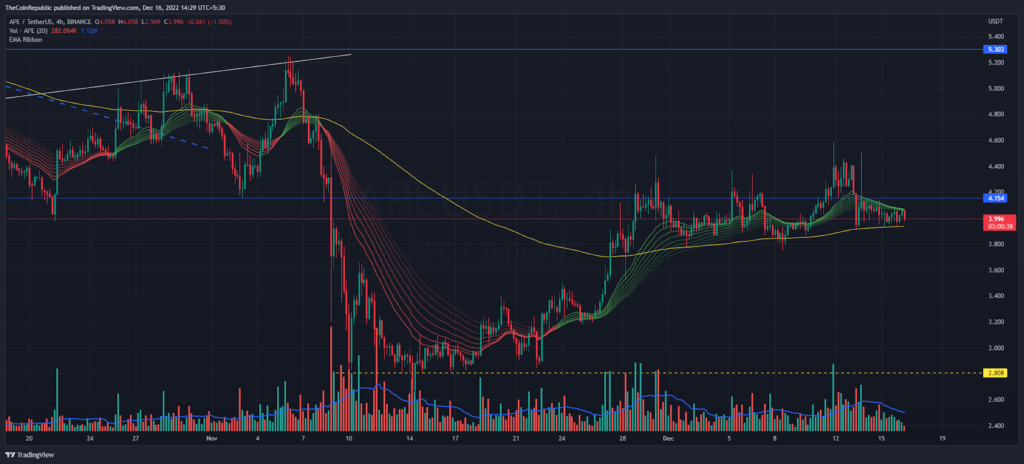
November became a profitable month for bulls because bulls reported back to back bullish weekly candles. ApeCoin price follows selling pressure this week. Resulting in buyers losing approximately 10% in last four days. Aside from weekly candle, market capitalization reported at $1.39 Billion along with 2.94 overnight drop.
Over the hourly chart, buyers barely manage APE crypto above 200 moving line of EMA Ribbon indicator. Below this short-term support level buyers may see price decline until $3.0 next support level. Aside from USDT pair, the APE belonging to the Bitcoin pair is up 2.78%, reported at 0.0002313 Satoshis.
ApeCoin on Daily Price Chart
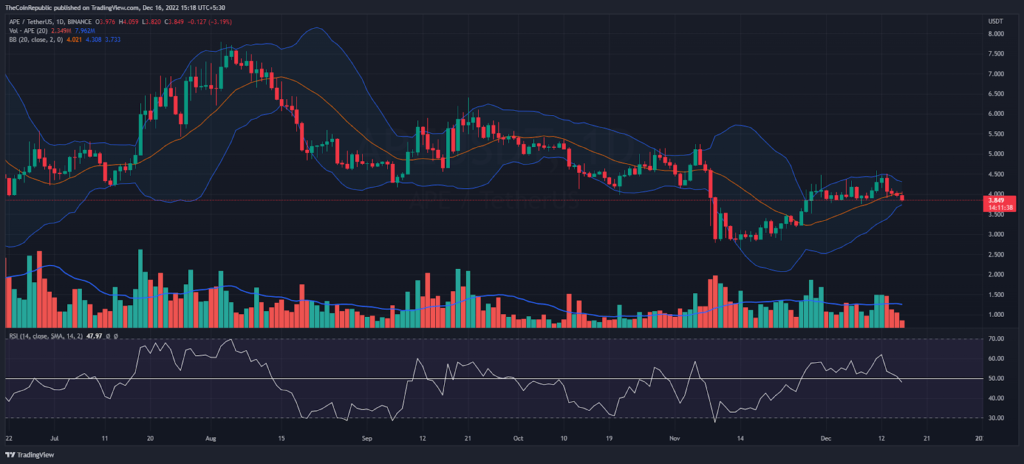
In terms of the daily price chart, ApeCoin price reversed from the upper band of the Bollinger Bands indicator. As a result, the crypto fell below the mid-band and more price declines are likely. Trading volume matters a lot for buyers to survive, trading volume fell by 20% to $138.1 billion in the last 24 hours.
The buyers have a short-term resistance near the $4.5 mark where they often fail to breach this level. In contrast, the $2.8 mark has been an important demand area so far. Furthermore, the semi-line of the RSI indicator is moving below the 50 mark during this weekly retracement phase.
Conclusion
ApeCoin appears to be dominated by sellers due to the retracement phase of the crypto market. After the Bollinger Bands indicator slips below the mid-band, the bulls struggle to hold the bullish zone.
Support level – $3.5 and $2.8
Resistance level – $4.5 and $5.3
Disclaimer
The views and opinions stated by the author, or any people named in this article, are for informational ideas only, and they do not establish financial, investment, or other advice. Investing in or trading crypto assets comes with a risk of financial loss.

Andrew is a blockchain developer who developed his interest in cryptocurrencies while pursuing his post-graduation major in blockchain development. He is a keen observer of details and shares his passion for writing, along with coding. His backend knowledge about blockchain helps him give a unique perspective to his writing skills, and a reliable craft at explaining the concepts such as blockchain programming, languages and token minting. He also frequently shares technical details and performance indicators of ICOs and IDOs.


