
 Home
Home News
News
- VET rejected 50 day ema and forming lower lows bearish candles
- MACD was unable to generate a positive crossover and RSI at 26 entered the oversold zone.
VET is trading with bearish cues and likely to witness more selling from the higher levels. As per coin glass, In the last 12 hours, Long and short ratio stood at 1.1 denotes buyers are more as compared to sellers but prices indicating opposite direction. As of now, VET/USDT is trading at $0.01551 with the intraday loss of 3.00% and 24 hour volume to market ratio stood at 0.0249
More downside in VET ?
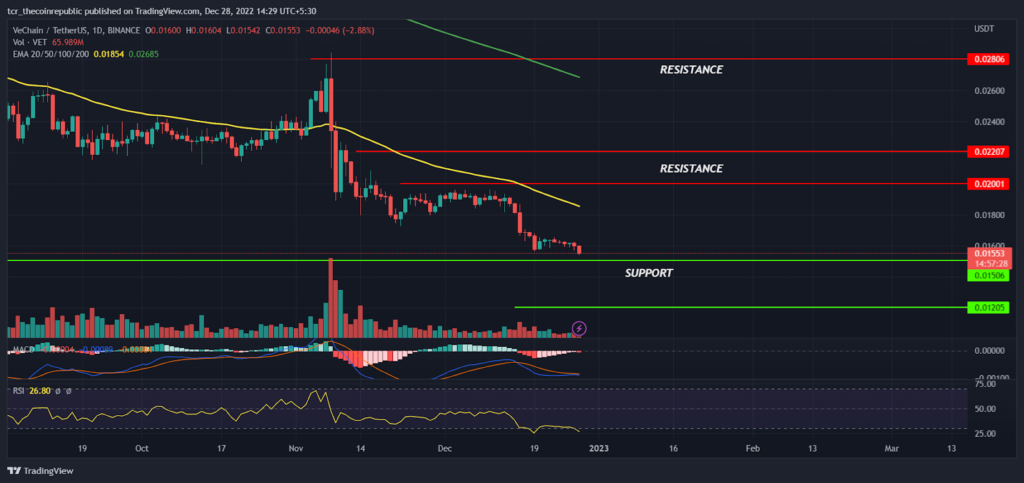
On a daily time frame, VET crypto price has been in a strong downtrend and bears are continuously dominating on higher levels. From the past couple of months VET prices are trading sideways in the range between $0.02207 to $0.02806 with the bearish bias but in the mid of November FTX collapse created panic and bears took this opportunity to break down the lower range support zones. Later, after a little bit consolidation prices continued their downward movement and are currently trading near the lowest level.
The 200 day ema(green) sloping down indicates a trend to remain weak on a positional basis and the 50 day ema (yellow) at $0.01854 will act as a strong hurdle for bulls if any relief rally triggers from the lower levels. On a lower side $0.01506 will act as an immediate support and next will be at $0.01205. Recently, MACD was attempting to positively cross the signal line but price did not gain momentum and MACD failed to generate a crossover whereas the RSI at 26 entered oversold zones which may trigger a temporary relief rally in coming weeks.
Temporary pullback rally possible ?
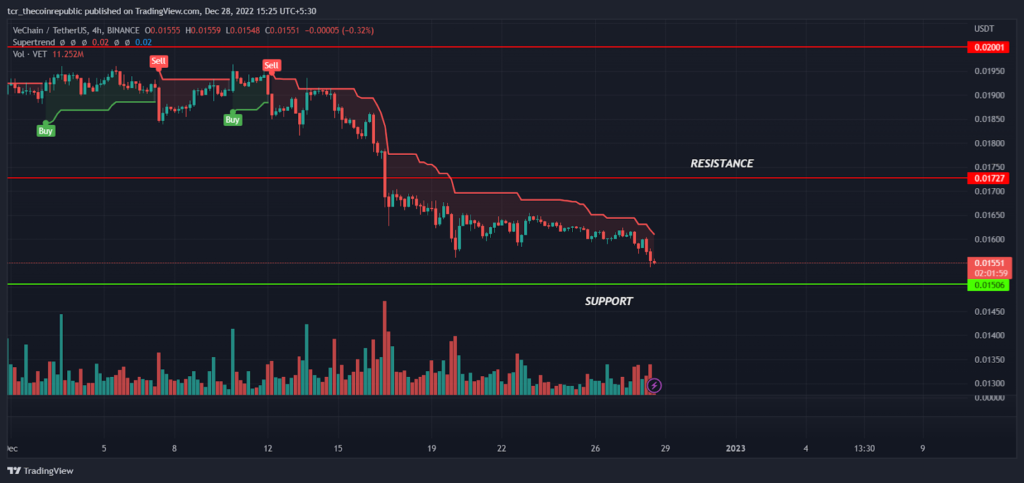
On a lower time frame, VET prices are trading with a bearish bias and slipping down while forming lower low swings. Recently, prices had broken down from the previous month low at $0.01727 which drived more negative sentiment and prices are sliding down towards fresh yearly lows. The supertrend indicator had generated a sell signal indicating a short term trend to remain bear grip and any upside relief rallies will be treated as a sell on rise opportunities.
Summary
VET prices are in a strong downtrend and bears are continuously dominating on higher levels. As per technical analysis, prices did not show any signs of upside trend reversal and buyers seem to be reluctant to accumulate at lower levels. However, aggressive traders might look for sell on rise opportunities by keeping $0.02001 as SL.
Technical levels
Resistance levels : $0.01727 and $0.02001
Support levels : $0.01506 and $0.01205
Disclaimer
The views and opinions stated by the author, or any people named in this article, are for informational ideas only, and they do not establish financial, investment, or other advice. Investing in or trading crypto assets comes with a risk of financial loss.

Andrew is a blockchain developer who developed his interest in cryptocurrencies while pursuing his post-graduation major in blockchain development. He is a keen observer of details and shares his passion for writing, along with coding. His backend knowledge about blockchain helps him give a unique perspective to his writing skills, and a reliable craft at explaining the concepts such as blockchain programming, languages and token minting. He also frequently shares technical details and performance indicators of ICOs and IDOs.


