
 Home
Home News
News
- Xpeng Inc stock price preparing to reverse the current declining rate of the XPENG share over the daily time frame chart.
- XPENG stock price must accumulate buyers to reverse the current trend at the support level of $9.45.
- Trading volume is below average and needs to be increased for XPENG to soar.
XPeng Inc stock price prediction suggests that the stock price has been declining from the past three trading sessions. Xpeng share price must reverse the current trend to recover over the daily price chart. However, XPEV stock needs to attract more buyers in order to recover itself from the current level. Meanwhile, Xpeng stock price has been declining since June 2022 and is currently trying to slow down the current downtrend momentum over the daily price chart. (XPEV:NYSE) XPeng Inc share price just soared and needs to accumulate buyers to recover itself over the daily time frame chart.
Xpeng Inc stock price is currently estimated at $9.43 and has lost 3.57% of its market capitalization in the past 24-hour period. Trading volume is still below average, which shows the lower accumulation rate of XPEV stock.
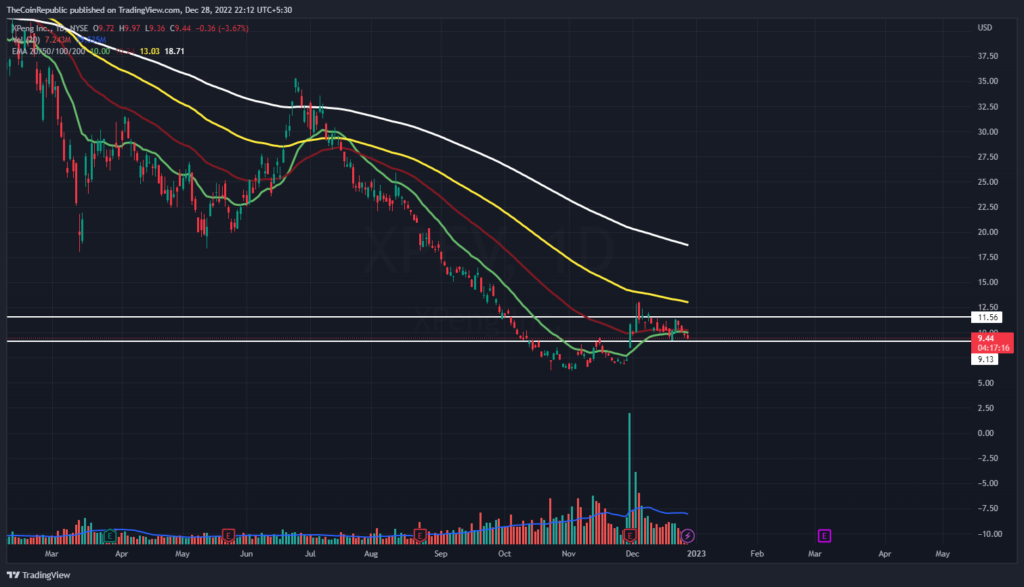
XPeng Inc Stock price is currently declining with strong downtrend momentum over the daily time frame chart. However, volume change can be seen below average and needs to grow for XPEV share price to surge. Meanwhile, XPeng stock price has declined below 20, 50, 100 and 200-days Daily Moving Average.
Monthly Gains of XPeng Stock Price
Xpeng stock price has dropped by 5.01% in the last week whereas it gained 37.54% during a time span of a month. XPEV shares must recover to showcase some positive signals of recovery in a quarter.
Technical Indicators Shows Declining Velocity of XPeng Stock
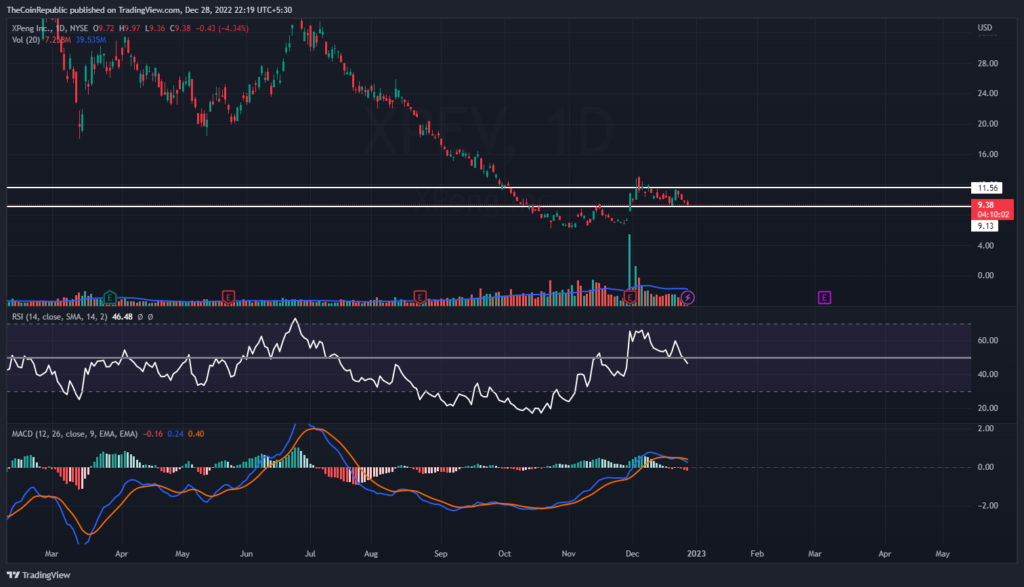
Technical indicators suggest the downtrend momentum of XPeng stock price over the daily time frame chart. Relative strength index showcases the declining streak of XPeng stock. RSI is at 46 and is below neutrality now moving towards the oversold territory. MACD exhibits the downtrend momentum of XPEV share price. The MACD line is below the signal line after a negative crossover. XPeng Inc investors need to wait until the stock price gathers support at the lower levels.
Summary
XPeng Inc stock price prediction suggests that the stock price has been declining from the past three trading sessions. Xpeng share price must reverse the current trend to recover over the daily price chart. Xpeng stock price has dropped by 5.01% in the last week whereas it gained 37.54% during a time span of a month. Technical indicators suggest the downtrend momentum of XPeng stock price over the daily time frame chart. The MACD line is below the signal line after a negative crossover. XPeng Inc investors need to wait until the stock price gathers support at the lower levels.
Technical Levels
Support Levels: $9.00 and $8.60
Resistance Levels: $11.00 and $13.00
Disclaimer
The views and opinions stated by the author, or any people named in this article, are for informational ideas only, and they do not establish financial, investment, or other advice. Investing in or trading crypto assets comes with a risk of financial loss.

Andrew is a blockchain developer who developed his interest in cryptocurrencies while pursuing his post-graduation major in blockchain development. He is a keen observer of details and shares his passion for writing, along with coding. His backend knowledge about blockchain helps him give a unique perspective to his writing skills, and a reliable craft at explaining the concepts such as blockchain programming, languages and token minting. He also frequently shares technical details and performance indicators of ICOs and IDOs.


