
 Home
Home News
News
- BSV price is struggling to trade above 50 day ema and likely to face resistance in monthly highs at $50.000
- MACD had generated a negative crossover whereas RSI at 45 sloping upside and may approach neutral level.
Bitcoin SV price is trading with the mild bullish cues and bulls were trying to defend the short term rising trendline. As per coinglass, In the last 12 hours, long and short ratio stood at 1.13 which indicates bullishness might continue in coming days. Currently, BSV/USDT is trading at $42.374 with the intraday gains of 2.85% and 24 hour volume to market ratio stood at 0.0548
Will the BSV Price respect the rising Trend line ?
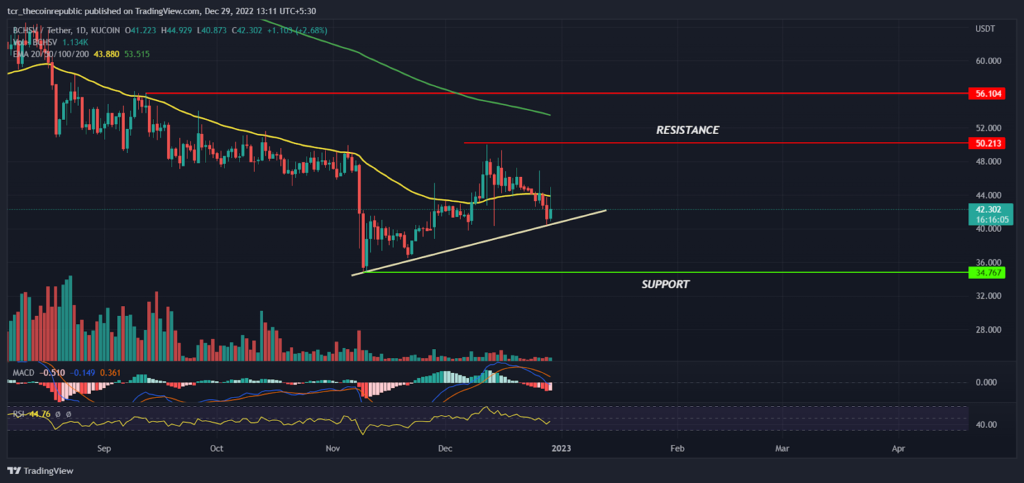
On a daily time frame, BSV Price had been in a short term uptrend and bulls were trying to keep the price above the rising trendline. From past couple of months, prices are trading in the range between $45.00 to $56.00 with the expectation of upside breakout but in the month of November, FTX collapse triggers panic selling all over the crypto industry and BSV also became a victim of sellers and prices had broke down its lower range and made a yearly low at $34.830. As of now, prices are in a recovery mode while forming higher high swings.
The 200 day ema(green) sloping down indicates trend to remain weak on long term basis and the 50 day ema (yellow) at $43 will act as an immediate hurdle in coming sessions followed next hurdle will be at $50.000 On a lower side, rising trendline will act as a support and next support will be at will be $34.767. The MACD had generated a negative crossover indicating mild bearishness may continue for some more time whereas RSI at 45 sloping upside and may approach neutral level.
Will the price continue its upside ?
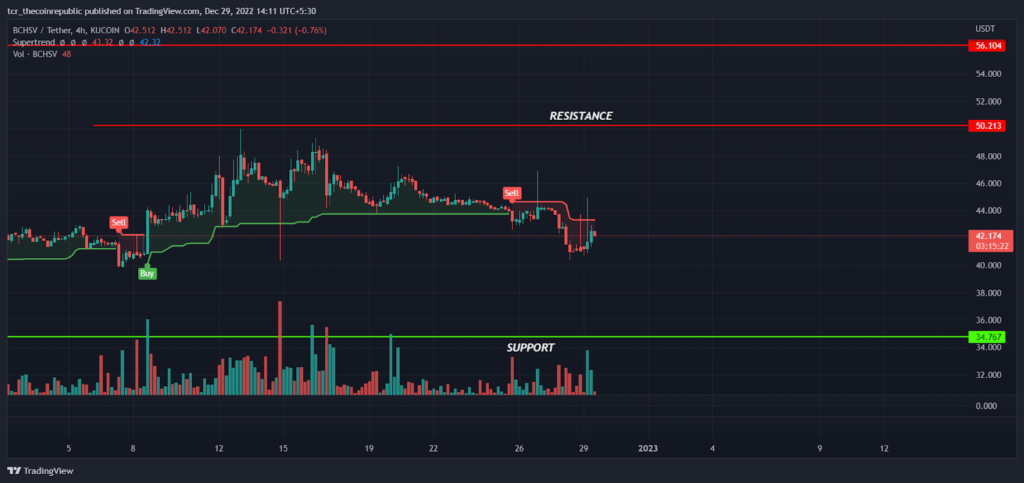
On a lower time frame, BSV prices looked quite stable and had kept the prices above the important support level of $40 indicating responsive buyers are active at lower levels. For the past couple of days prices had been trading in the tight range between $40.00 to $48.00 and likely to see breakout on either side soon. Recently, the supertrend indicator had generated a sell signal which triggered a negative sentiment for short term traders but prices are trading near to lower range support zone so, it became risky to create positions at lower levels.
Summary
BSV prices had shown strong recovery from the recent lows at 34.767 and likely to continue its upside momentum only if bulls succeed to trade above 50 day ema in coming days. As per technical analysis, prices are in a short term uptrend and may witness buying from the lower levels. So, aggressive traders might look for buying opportunities for the target of $50.000 and above by keeping $38.000 as SL. However, if prices slipped below $38.000 bears may drag it further down towards $34.000 and below levels.
Technical levels
Resistance levels : $50.213 and $56.104
Support levels : $40.000 and $34.767
Disclaimer
The views and opinions stated by the author, or any people named in this article, are for informational ideas only, and they do not establish financial, investment, or other advice. Investing in or trading crypto assets comes with a risk of financial loss.

Nancy J. Allen is a crypto enthusiast, with a major in macroeconomics and minor in business statistics. She believes that cryptocurrencies inspire people to be their own banks, and step aside from traditional monetary exchange systems. She is also intrigued by blockchain technology and its functioning. She frequently researches, and posts content on the top altcoins, their theoretical working principles and technical price predictions.


