- Gevo Inc stock price has been declining from the year 2021, GEVO stock has been down by 60% year to date.
- GEVO share price is trying to maintain the current bullish momentum over the daily time frame chart.
- The headquarters of Gevo, Inc., a manufacturer of innovative biofuels and renewable chemicals, is located in unincorporated Douglas County, Colorado, which is part of the Denver-Aurora metropolitan region.
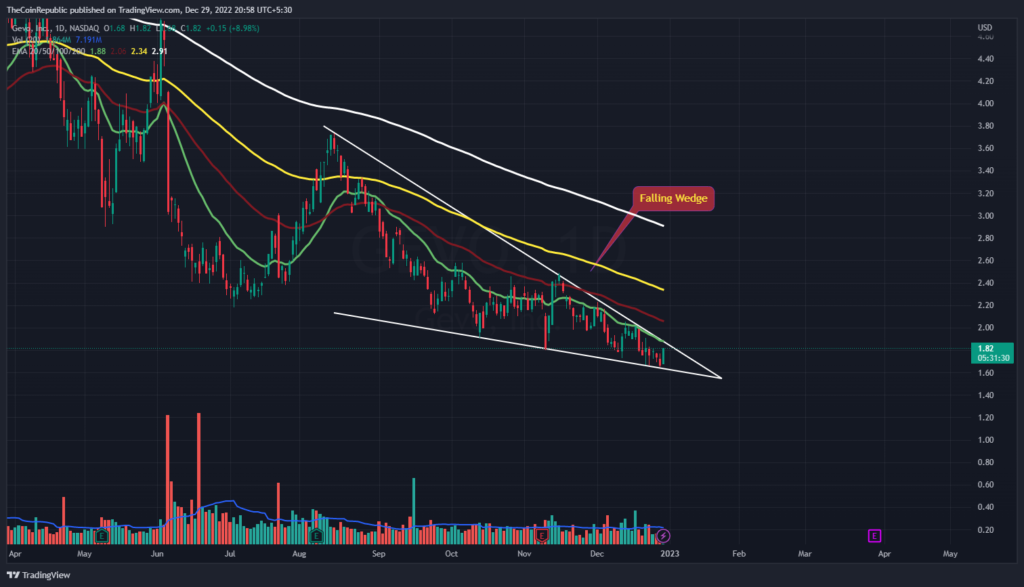
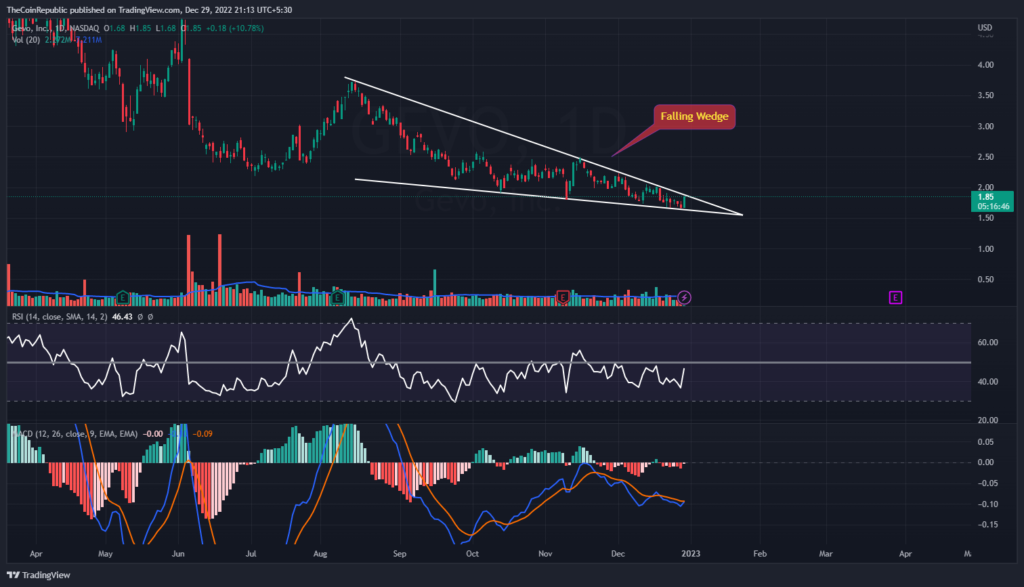
Gevo Inc stock price is trying to break out from an interesting falling wedge over the daily time frame chart. GEVO stock is trying to acquire investors’ attention as the stock has been declining since 2021. Now GEVO Inc must attract some attention from investors to maintain itself between the market leaders of Biofuels and renewable chemicals all around the globe. However, the current roadmap of GEVO states the sustainability issue of the share price at the verge of the falling wedge pattern. GEVO stock needs to escape the falling wedge pattern to surge more during Thursday’s trading session.
Gevo Inc was trading at 1.82% with a gaining rate of 10.78% in the past 24-hour period. Trading volume is also soaring up as buyers are getting indulged in the trade for GEVO share. This demonstrates that GEVO share is trying to maintain its dignity over the daily time frame chart.

Gevo Inc stock price must surge out of the falling wedge pattern over the daily time frame chart. However, volume change is still below and needs to grow during the day’s trading session for the share price to register its successful breakout. Meanwhile, GEVO stock is trying to recover towards 20-EMA and is way below 50, 100 and 200-days Daily Moving Average.
Past-Present-Future (Gevo Inc Stock Price 2023) in a Nutshell:
Gevo Inc stock price has been declining since the start of 2022 and has kept on slipping making lower lows over the daily time frame chart. Gevo stock price has slipped around 60% year to date which defines the hurdle race and a backlash of GEVO stock. Talking about the present, Gevo Inc share (NASDAQ: GEVO) is currently preparing for a bigger move as soon as it breaks out from the falling wedge pattern and has gained 10.78% throughout Thursday’s trading session.
Future of Gevo Inc stock price (ie. Gevo Inc Stock price 2023) states that the median target price among the five analysts who are providing 12-month price projections for Gevo Inc. is 5.00, with high and low estimates of 18.00 and 2.25, respectively. From the most recent price of $1.67, the median projection predicts a +200.30% rise.
This Technical Indicator is about to Showcase a Positive Crossover (GEVO Stock):

Technical indicator suggests strong uptrend momentum of GEVO stock price over daily time frame chart. Relative Strength Index showcases strong upward velocity of GEVO share. RSI is at 46 and is about to break out from neutrality towards overbought territory.
MACD is about to showcase a positive crossover between MACD and Signal lines. Gevo Investors need to wait for the stock price to register its breakout from the falling wedge pattern.
Summary
Gevo Inc stock price is trying to break out from an interesting falling wedge over the daily time frame chart. GEVO stock is trying to acquire investors’ attention as the stock has been declining since 2021. However, volume change is still below and needs to grow during the day’s trading session for the share price to register its successful breakout. Gevo stock price has slipped around 60% year to date which defines the hurdle race and a backlash of GEVO stock. RSI is at 46 and is about to break out from neutrality towards overbought territory. Gevo Investors need to wait for the stock price to register its breakout from the falling wedge pattern.
Technical Levels
Support Levels: $1.65 and $1.60
Resistance Levels: $1.90 and $2.00
Disclaimer
The views and opinions stated by the author, or any people named in this article, are for informational ideas only, and they do not establish financial, investment, or other advice. Investing in or trading crypto assets comes with a risk of financial loss.

Andrew is a blockchain developer who developed his interest in cryptocurrencies while pursuing his post-graduation major in blockchain development. He is a keen observer of details and shares his passion for writing, along with coding. His backend knowledge about blockchain helps him give a unique perspective to his writing skills, and a reliable craft at explaining the concepts such as blockchain programming, languages and token minting. He also frequently shares technical details and performance indicators of ICOs and IDOs.


 Home
Home News
News


