
 Home
Home News
News

- The AVAX token price is trading below the demand zone on a daily time frame.
- The pair of AVAX/USD is trading at the price level of $11.34 with a gain of 1.59% in the past 24 hours.
In 2022, the blockchain network Avalanche (AVAX) saw its fortunes plummet. AVAX, Avalanche’s native token, has dropped from the top ten most valuable cryptocurrencies by market capitalization to number 18 after losing more than 85% of its value in 2022.

AVAX on the daily chart
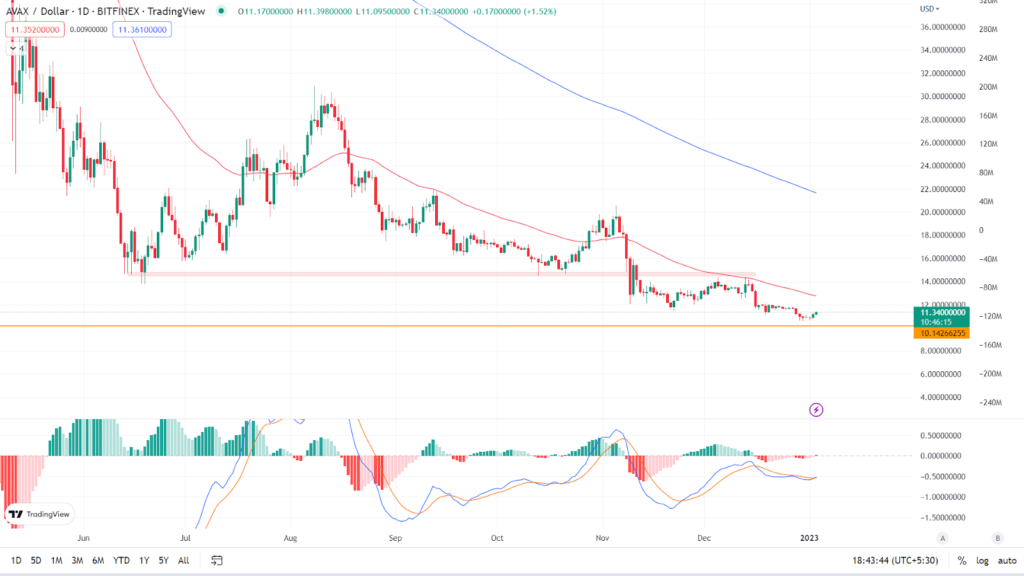
The token’s overall trend is bearish, with lower highs and lower lows. Token has dropped below the demand zone and is continuing to drop. On the daily chart, AVAX is presently trading at $11.34, up 1.59% in the last 24 hours. The price is trading below its main Moving Averages (50 and 200 EMA). (The blue line represents the 200 EMA, while the red line represents the 50 EMA.) We can see bulls trying to gain traction after a run of red candles and bears dominance over bulls.

MACD: On MACD, we can notice a bullish crossover. A bullish crossover occurs when the MACD blue line crosses the Orange signal line in an upward direction. In the next few days, we may witness bullish momentum in token.
Analyst view & Expectations
The token is still in a downtrend and is encountering resistance at the 50 EMA. Bullish crossover may bring a short-term bullish trend or pullback till 50 EMA. To reverse the trend, the token must cross and hold the 50 EMA. Investors are advised not to buy at this time since this is a pullback rather than a shift in trend. Intraday traders have a good opportunity to buy and can aim for $11.92 or the 50 EMA.
According to our current Avalanche price prediction, the price of Avalanche will fall by -1.94% and hit $ 11.12 in the coming days. Our technical indicators indicate that the current sentiment is bearish, with the Fear & Greed Index reading 26. (Fear). Over the previous 30 days, Avalanche had 12/30 (40%) green days and 8.18% price volatility. According to our Avalanche forecast, now is not the moment to buy Avalanche.
Technical Levels
Major support: $10.77
Major resistance: $11.95
Conclusion
On a daily chart, the AVAX token price has dropped below the demand zone. The AVAX token price is forming a bearish chart pattern, according to the price action. It remains to be seen if the token price can rebound from the long-term demand zone or break through and fall. Investors should wait for a clear indication before investing.
Disclaimer: The views and opinions stated by the author, or any people named in this article, are for informational ideas only, and they do not establish the financial, investment, or other advice. Investing in or trading crypto assets comes with a risk of financial loss.
Steve Anderson is an Australian crypto enthusiast. He is a specialist in management and trading for over 5 years. Steve has worked as a crypto trader, he loves learning about decentralisation, understanding the true potential of the blockchain.


