
 Home
Home News
News

- Litecoin price prediction suggests the token’s recovery phase over the daily time frame chart.
- LTC crypto has recovered above 20, 50, 100 and 200-days Daily Moving Average.
- The pair of LTC/BTC is at 0.004478 BTC with an intraday drop of 0.22%.
Litecoin price prediction suggests the token’s recovery rate over the daily time frame chart. LTC crypto has been trying to recover after falling from a rising wedge pattern over the daily time frame chart. However, volume change is currently below average and needs to grow for LTC crypto to recover over the daily time frame chart. LTC needs to accumulate more buyers during the intraday trading session over the daily time frame chart.

Litecoin price was at $75.66 and has lost 0.89% of its market capitalization in the last 24-hour period. Trading volume has decreased by 6.89% during the intraday trading session. This demonstrates that sellers are approaching for a pullback.

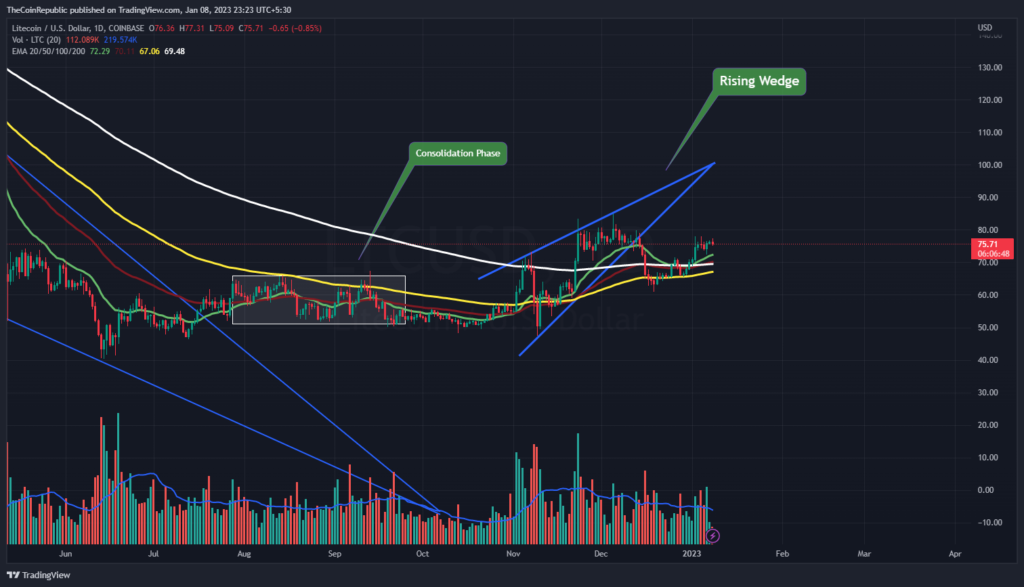
Litecoin price prediction suggests the token’s recovery phase over the daily time frame chart. However, trading volume is still below average and needs to grow for LTC to surge with strong uptrend momentum over the daily time frame chart. Meanwhile, LTC crypto has recovered above 20, 50, 100 and 200-days Daily Moving Average.
What do Technical Indicators suggest about Litecoin Price?

Technical indicators suggests the token’s downtrend momentum over the daily time frame chart. Relative Strength Index showcases the downtrend momentum of LTC crypto. RSI is at 60 and is moving towards neutrality. MACD exhibits the downtrend momentum of LTC crypto. The MACD line above the signal line but is falling towards the signal line for negative crossover. Investors in Litecoin needs to wait for any directional change over the daily time frame chart.
Summary
Litecoin price prediction suggests the token’s recovery rate over the daily time frame chart. LTC crypto has been trying to recover after falling from a rising wedge pattern over the daily time frame chart. However, trading volume is still below average and needs to grow for LTC to surge with strong uptrend momentum over the daily time frame chart. Technical indicators suggests the token’s downtrend momentum over the daily time frame chart.
Technical Levels
Support Levels: $70.00 and $65.00
Resistance Levels: $80.00 and $85.00
Disclaimer
The views and opinions stated by the author, or any people named in this article, are for informational ideas only, and they do not establish financial, investment, or other advice. Investing in or trading any assets comes with a risk of financial loss.

Andrew is a blockchain developer who developed his interest in cryptocurrencies while pursuing his post-graduation major in blockchain development. He is a keen observer of details and shares his passion for writing, along with coding. His backend knowledge about blockchain helps him give a unique perspective to his writing skills, and a reliable craft at explaining the concepts such as blockchain programming, languages and token minting. He also frequently shares technical details and performance indicators of ICOs and IDOs.


