
 Home
Home News
News
Norwegian Cruise Line Holdings Ltd. (NYSE: NCLH) stock showed a trend reversal this week. NCLH stock leaps with its sectoral associate cruise line stocks pumped up with gains.
This sectoral move starts on Wednesday when the cruise line indicates schemes to raise the prices. Most sectoral shares sharply rolled upside amid the corrective movement of markets on the same day.

NCLH stock price was revamped from the last three sessions showing successive buying. Bulls engulfed the sellers, and a long buildup was witnessed. The share price last traded at $13, with a gain of 0.15% at the close. Price jumped nearly 11% in the last 7 trading sessions.
Daily Chart Showing Rounding Top Formation
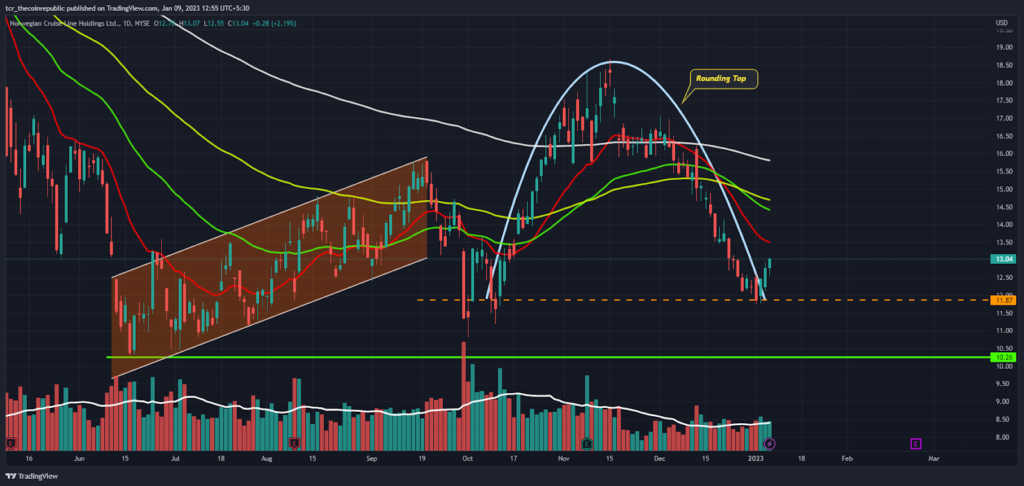
NCLH daily chart showcases rounding top formation, which has its bottom at $11 yet not broken, and the price retraces back. This bounce back from the support range set the bullish momentum for bulls. Moreover, the investors staying for the perfect entry setup have also entered.
The stock is now approaching its 20 days EMA placed at $13.50, which is yet to be tested in the upcoming sessions. Moreover, the technical parameters indicate that the trend will carry more upside till the price sustains above $13.
In the past months, NCLH stock has done its corrective move with volatile moves. However, this year was not good for the stock as the long-term trend was negative.
The setup now conveys a path maker for bulls to fly towards 20, 50 days EMA. As per Fib retracement, the price was taking a prompt hurdle of $13.53. It will rally to $15 in the upcoming sessions if it sustains above it.
Bullish Crossover On shorter Time Frame
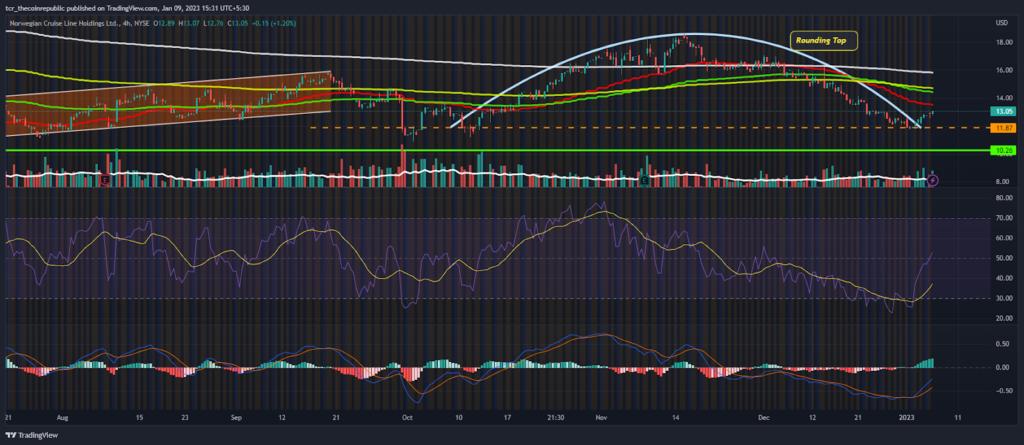
NCLH stock on the 4 hours chart exhibits bullish cues with a positive stance. The recent swings led to a momentum transition towards the bulls. In the recent sessions, the RSI curve pulled out from the oversold region to the neutral zone at 50, leading toward the buying range.
Moreover, the MACD indicator gave a bullish crossover in the recent sessions, and the histogram undoubtedly favoured bulls.
Conclusion
NCLH stock price is now trading at favourable levels, ready for a further breakout. In the prior sessions, the stock gave bullish moves with a rise in volumes mirroring that stock retraced back from the support range, and follow-on buying was noticed. The stock may also go ahead if it maintains above $13.
Technical Levels
Support levels: $12 and $10
Resistance Levels: $14 and $16
Disclaimer
The views and opinions stated by the author, or any people named in this article, are for informational purpose only, and they do not establish financial, investment, or other advice. Investing in or trading crypto assets comes with a risk of financial loss.

Andrew is a blockchain developer who developed his interest in cryptocurrencies while pursuing his post-graduation major in blockchain development. He is a keen observer of details and shares his passion for writing, along with coding. His backend knowledge about blockchain helps him give a unique perspective to his writing skills, and a reliable craft at explaining the concepts such as blockchain programming, languages and token minting. He also frequently shares technical details and performance indicators of ICOs and IDOs.


