
 Home
Home News
News

- Link token price struggles to hold the 50 day EMA and faces rejection from the supply zone
- ChainLink token price had recovered 26% from the demand zone and technical indicators turning bullish
- The MACD had generated positive crossover and RSI at neutral level
Chainlink token price is trading with the bullish cues and bulls are trying to keep the price above the 50 day EMA but it seems like buyers are lacking momentum near the supply zones. Currently, The pair of LINK/USDT is trading at $6.445 with an intraday gains of 1.75% and the 24-hour volume to market cap ratio stood at 0.1201

Will the Link price be able to break the swing high hurdle ?
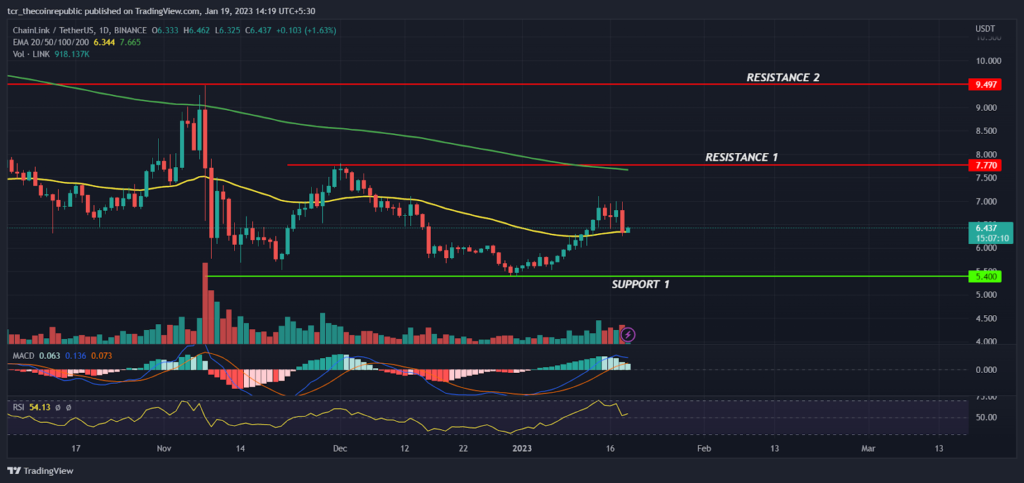
On a daily time frame, Link token prices are in a downtrend and have tried multiple times to break out of EMA’s but got rejected indicating the bear dominance on the higher levels. From the past couple of months, Link prices are trading sideways in the wide range between $5.400 to $9.500 with bearish bias and failed to attract the investors money. Recently, prices took support at $4.500 and gained some positive momentum but it seems difficult for bulls to hold the current levels.

Link token prices had breakout of the 50 day EMA (yellow) hurdle which had created a hope for bullish traders but prices seem to be lacking the momentum and may face immediate resistance at the 200 day EMA(green) in the coming sessions. However, if bulls are able to break out of the $8.00 hurdle level we may see a short term trend reversal in the favor of bulls which can take the prices upwards towards $10.00.
The technicals of the link prices are turning bullish but the confirmation will come when prices will be able to break out of the $10 hurdle level, till then it is better to look for trading the mean reversal opportunities. On the lower side, $5.400 is acting as a savior for bulls. The MACD had generated a positive crossover but the curve sloping sideways denotes choppiness and the RSI at 53 denotes the balance between bullish and bearish positions.
Summary
Link token price has stuck in the wide range and price action does show any signs of breakout in the short term period.The bulls have tried to hold the prices above the 50 day EMA but it seems buyers are losing the grip near the supply zones. Therefore, traders might look for playing the meaning reversal opportunities by keeping the boundaries of supply and demand zone as SL.
Technical levels
Resistance levels : $7.800 and $9.500
Support levels : $5.400 and $4.000
Disclaimer
The views and opinions stated by the author, or any people named in this article, are for informational purposes only, and they do not establish financial, investment, or other advice. Investing in or trading crypto assets comes with a risk of financial loss.

Nancy J. Allen is a crypto enthusiast, with a major in macroeconomics and minor in business statistics. She believes that cryptocurrencies inspire people to be their own banks, and step aside from traditional monetary exchange systems. She is also intrigued by blockchain technology and its functioning. She frequently researches, and posts content on the top altcoins, their theoretical working principles and technical price predictions.


