
 Home
Home News
News

- The token has shown bearish actions in the previous sessions.
- The pair of LEO/USDT is trading at the price level of $3.452 with a decrease of -0.35% in the past 24 hours.
On a daily time frame, the LEO token is now trading above the demand zone. The bears are driving the trend, with the token’s price forming lower highs and lower lows. Let’s see whether the token can recover from the demand zone and reverse the trend.

LEO token on the daily chart
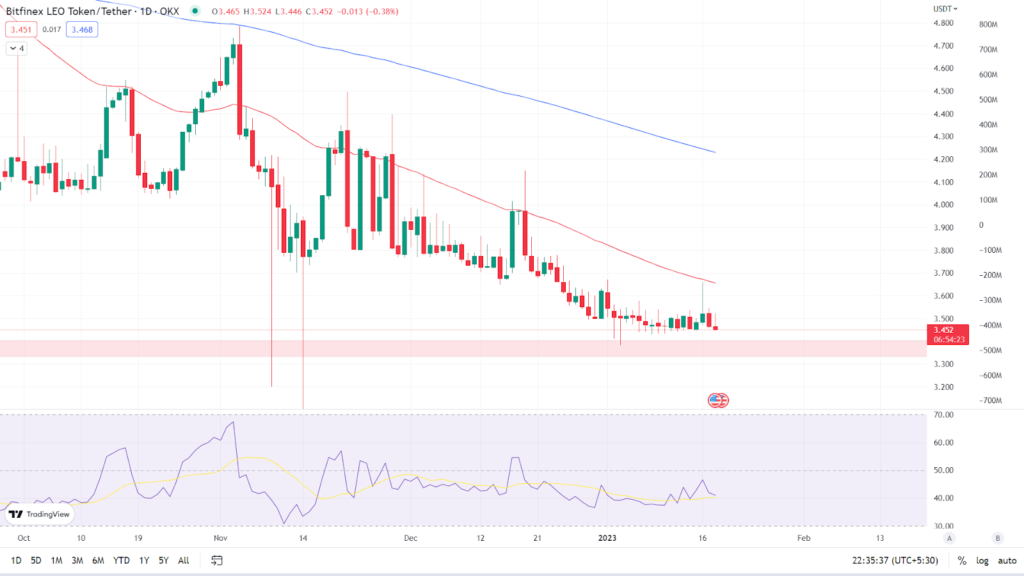
Like any other cryptocurrency, the token’s overall outlook is bearish. According to the daily chart, LEO token is currently trading at $3.452 with a -0.35% loss in the last 24 hours. It is trading below its key Moving Averages (50 and 200 EMA). (Red line is 50 EMA and the blue line is 200 EMA). The token is constantly facing resistance at the 50 EMA and is unable to break and sustain above it on a daily time frame.

Relative Strength Index: The asset’s RSI curve is currently trading at 41.35, indicating that it is in the oversold zone. RSI curve is yet to cross the halfway mark of 50. Once the token price breaks the 50 EMA, the RSI curve can be seen moving upward crossing the halfway mark of 50, supporting the trend of the LEO token. If the token continues the fall below the demand zone, the RSI curve can be seen falling further.
Analyst view & Expectations
For a long time, the token has been trading in a downtrend, with bears in control. Investors are recommended not to buy now and to wait for the token to bounce from the demand zone with bullish momentum to gain more information on the trend’s direction. Intraday traders, on the other hand, have a good opportunity to go short if the price falls below the demand zone and book profits based on their risk to reward ratio.
According to our current UNUS SED LEO price projection, the value of UNUS SED LEO will fall by -3.23% and hit $ 3.32 in the next few days. Our technical indicators indicate that the current sentiment is bearish, with the Fear & Greed Index reading 52. (Neutral). Over the previous 30 days, UNUS SED LEO had 10/30 (33%) green days and 3.09% price volatility. According to our UNUS SED LEO forecast, now is not the time to buy UNUS SED LEO.
Technical Levels
Major support: $3.331
Major resistance: $3.733 & 50 EMA on the daily time frame
Conclusion
The LEO token price is forming a bearish chart pattern, according to the price action. It remains to be seen if the token price can rebound from the long-term demand zone or break through and drop. Investors should wait for a clear indication before acting.
Disclaimer: The views and opinions stated by the author, or any people named in this article, are for informational ideas only, and they do not establish the financial, investment, or other advice. Investing in or trading crypto assets comes with a risk of financial loss.

Nancy J. Allen is a crypto enthusiast, with a major in macroeconomics and minor in business statistics. She believes that cryptocurrencies inspire people to be their own banks, and step aside from traditional monetary exchange systems. She is also intrigued by blockchain technology and its functioning. She frequently researches, and posts content on the top altcoins, their theoretical working principles and technical price predictions.


