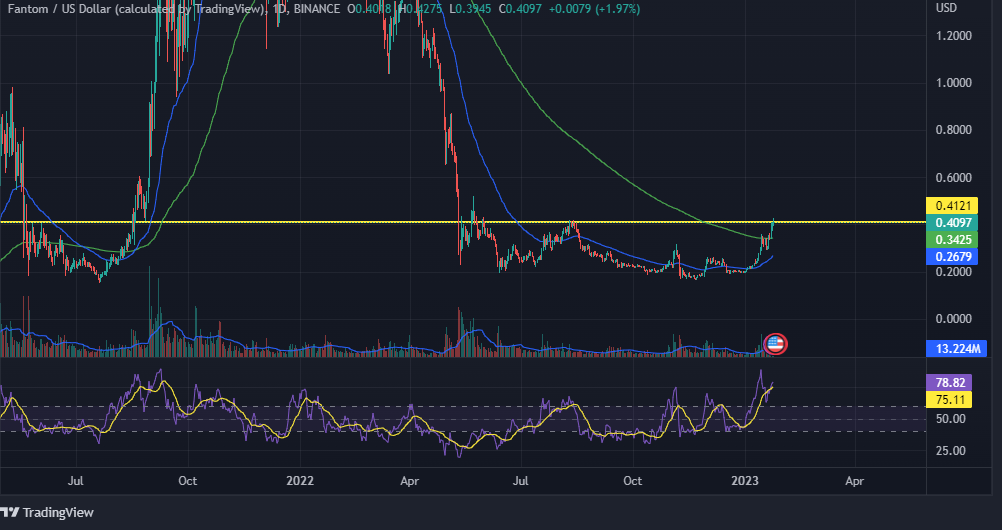
- The coin is in a sideways trend.
- A basic price action breakout is on the way.
The coin is presently trading at its resistance level which is marked by a horizontal line. A bull move can be seen in the next few days.
FTM on daily time frame


On the daily chart, a horizontal line is marked which shows that price has been unable to break these levels and has shown pull back from these levels several times. So if price breaks these levels we can see a good rally upside. The price is expected to move to its next nearby resistance i.e. $0.4988.
MACD – On the indicator MACD a bullish crossover has taken place showing that FTM has gained bullish momentum on the daily chart. The bullish crossover on the indicator also shows that bulls have taken over bears.
Relative Strength Indicator (RSI) – The RSI curve of relative strength indicator has crossed its 50-point level and is now at 78.88. The rise in the coin values has increased the RSI curve. If the price rises even more the RSI curve can soar higher.
Analyst views and expectations
Short-term investors should keep an eye on the coin’s daily chart because as soon as the coin gives this horizontal line breakout an opportunity will be generated for them to make a good amount of money in a short span of time. Long-term investors should wait for some more time and then invest in the coin to get some great returns over a period of two to three years.
CoinCodex site’s analysis as a whole was neutral with 22 indicators producing bullish indications and 9 producing bearish ones.
DigitalCoinPrice forecast the price of cryptocurrency stating that it may reach $1.12 in 2025 and $3.53 in 2030.
PricePrediction estimated a potential $0.39 annual average in 2023 and a potential $0.56 annual average in 2024. The website then forecast a fantom price of $0.81 for 2025. According to the website, FTM could increase to $5.13 by 2030.
WalletInvestor predicts that FTM’s price will drop to just $0.0197 by December 14 of 2023, indicating that the coin would face a difficult year.
Technical Levels
Major resistance -$0.8017
Major support -$0.1710
Conclusion
The coin can generate some great returns for short-term investors over a short period of time.
Disclaimer: The opinions represented in this work along with any other opinions are presented primarily for informative purposes and are not intended to be taken as investment advice.
Steve Anderson is an Australian crypto enthusiast. He is a specialist in management and trading for over 5 years. Steve has worked as a crypto trader, he loves learning about decentralisation, understanding the true potential of the blockchain.


 Home
Home News
News


