
 Home
Home News
News
- The token has shown bullish actions in the previous sessions.
- Threshold token has sustained above the resistance level on the daily time frame.
The Threshold (T) token has surged by more than 140% in the last few days, with current investors benefiting the most. Bulls have beaten the bears and are in a strong uptrend, driving the token’s price higher.
Threshold token on the daily chart
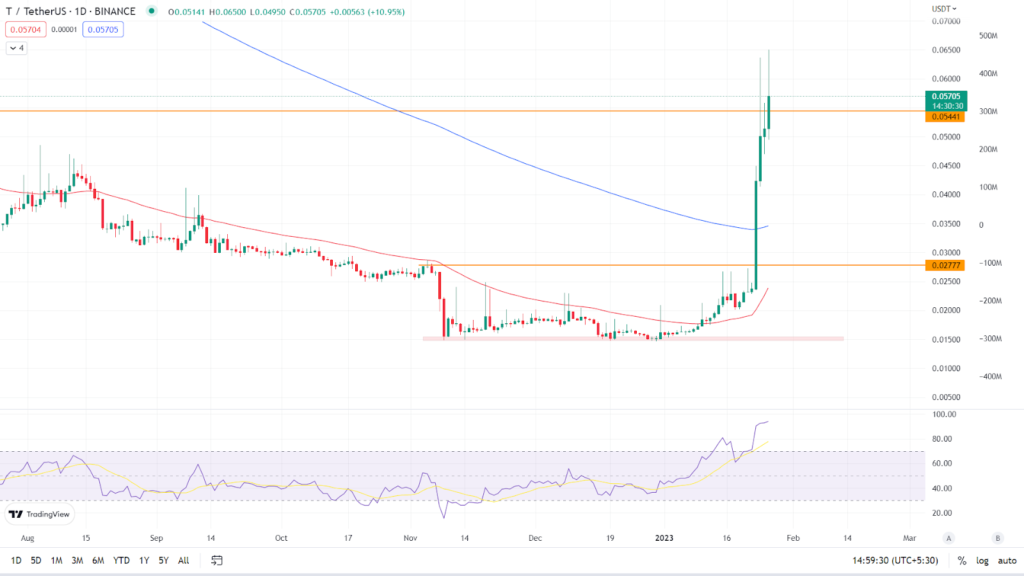
In the daily time frame, the token has broken out of the consolidation zone with high volume, forming a strong bullish candle. Threshold token is currently trading at $0.0570, up 11.11% in the last 24 hours, as seen on the daily chart. It has crossed and sustained above its key Moving Averages, the 50 EMA and the 200 EMA. (Red line is 50 EMA and the blue line is 200 EMA). In the daily time frame, the token broke through and stayed above the resistance level.
Relative Strength Index: The asset’s RSI curve is currently trading at 93.30, indicating that it is in a strong overbought zone. The value of the RSI curve has increased as the token price has risen. The RSI curve has crossed the 14 SMA upward indicating that the token is bullish. If the bulls continue to drive up the token’s price in the coming days, the RSI curve’s value will remain in the overbought zone.
Analyst view & Expectations
The token has gained more than 140% in the last few days without any pullback or retracement, thus the possibilities of a pullback in the coming days are higher. Investors who want to buy can do so because the token is on a strong uptrend, while those who want to trade safely can wait for a pullback before buying. Intraday traders, on the other hand, have a good opportunity to go long and book profits based on their risk to reward ratio.
According to our current Threshold Network Token price prediction, the value of Threshold Network Token is expected to fall by -4.75% in the next few days, reaching $ 0.054711. Our technical indicators indicate that the current sentiment is bullish, with the Fear & Greed Index reading 54. (Neutral). Over the last 30 days, Threshold Network Token had 23/30 (77%) green days and 40.78% price volatility. According to our Threshold Network Token forecast, now is a good time to buy Threshold Network Token.
Conclusion
The bulls have taken the command of the trend and are enjoying their dominance over the bears and forming a bullish chart pattern as per the price action. Investors who want to buy now can do so by managing their risk to reward ratio.
Disclaimer: The views and opinions stated by the author, or any people named in this article, are for informational ideas only, and they do not establish the financial, investment, or other advice. Investing in or trading crypto assets comes with a risk of financial loss.

Andrew is a blockchain developer who developed his interest in cryptocurrencies while pursuing his post-graduation major in blockchain development. He is a keen observer of details and shares his passion for writing, along with coding. His backend knowledge about blockchain helps him give a unique perspective to his writing skills, and a reliable craft at explaining the concepts such as blockchain programming, languages and token minting. He also frequently shares technical details and performance indicators of ICOs and IDOs.


