
 Home
Home News
News

- Loopring token price broke out of the monthly high at 0.3680 and forming a bullish pattern
- LRC token price sustained above the 200 day EMA and heading for the golden EMA crossover
- LRC token technical indicators turned bullish but the RSI entered into the overbought zone
Loopring token price is trading with the bullish cues and bulls are trying to break out of the swing high hurdle level. According to the Coingalss, In the last 12 hours, the Long and Short ratio stands at 0.93 which denotes the divergence between the bullish and bearish sentiments. Currently, The pair of LRC/USDT is trading at $0.4247 with an intraday gains of 8.29% and the 24-hour volume to market cap ratio at 0.427

Will LRC token price take halt at the supply zone ?
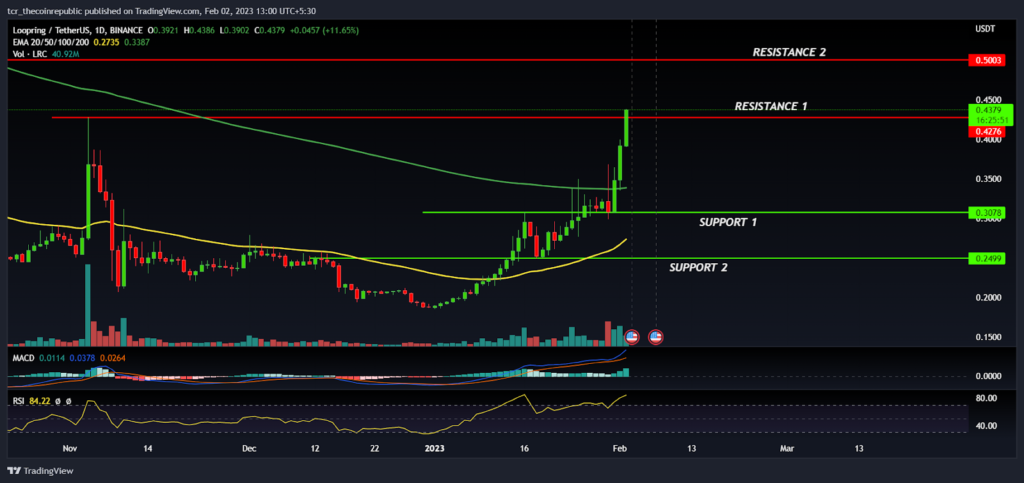
On a daily time frame, Loopring token price is picking up momentum and rising upward while forming a three white shoulder pattern which indicates that the buyers are coming back to the track to dominate the LRC prices on the higher levels.

Recently, In the mid of January, The LRC token prices has reclaimed the 50 day EMA which has derived the positive sentiment for the short term traders and prices continued the momentum by forming higher high candles.The 200 day EMA is acting as hurdle level for the bulls but surprisingly bulls have also succeeded to breakout of the 200 day EMA which confirms that the positional trend has in the favor of bulls. However, the prices are entering into the supply zone and it will be difficult for bulls to hold the higher levels.
Meanwhile, the technical indicators of the LRC token turned bullish and indicated the upward direction but the RSI curve at 83 denotes overbought levels which can create trouble for the short term traders. However, if any minor correction triggers from the supply zone then $0.3078 to $0.2499 will be a demand zone for the bulls. The MACD has generated a positive crossover showing the strength of the bulls whereas the price action shows that the token prices is over extended and might enter into wide range consolidation.
Summary
The Loopring token price had shown a surprising rally and succeeded to break out of both the important EMA’s indicating the confidence of bulls at the lower levels. The technical analysis suggests that the recent up-move is sustainable but the prices seem to be overextended and might enter into consolidation.Therefore, traders may look for buying opportunities when price retrace towards the 50 day EMA for getting the better risk ratio.
Technical levels
Resistance levels : $0.5000 and $0.4500
Support levels : $0.3078 and $0.2499
Disclaimer
The views and opinions stated by the author, or any people named in this article, are for informational purposes only, and they do not establish financial, investment, or other advice. Investing in or trading crypto assets comes with a risk of financial loss.

With a background in journalism, Ritika Sharma has worked with many reputed media firms focusing on general news such as politics and crime. She joined The Coin Republic as a reporter for crypto, and found a great passion for cryptocurrency, Web3, NFTs and other digital assets. She spends a lot of time researching and delving deeper into these concepts around the clock, and is a strong advocate for women in STEM.


