
 Home
Home News
News

- FXS token price broke out of the previous week high and formed a giant bullish bullish candle
- FXS price sustained above 200 day EMA and generated a golden EMA crossover
- The technical indicators of Frax Share token is turning bullish
Frax Share (FXS) crypto price is trading with bullish cues and the bulls are trying to show its dominance on the higher levels. According to the coinglass, In the last 12 hours Long and Short ratio stands at 1.07 which denotes that long takers are more as compared to short takers. Currently, The pair of FXS/USDT is trading at $13.197 with an intraday gains of 8.97% and the 24-hour volume to market cap ratio at 0.2305

More rally is possible in FXS token ?
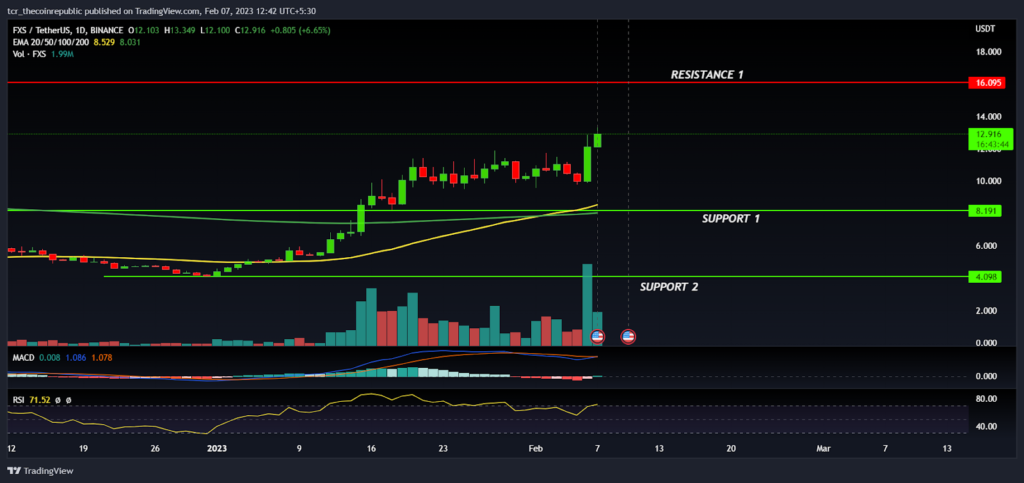
On a daily time frame, FXS token price is on steady rise and forming a bullish continuation pattern. The token has broken out of the narrow range consolidation with the giant bullish candle which indicates that the buyers are returning back to the track and expecting more upward movement in the coming days.

In the mid of January, The FXS token price has reclaimed the 50 and 200 day EMA which has reversed the positional trend in the favor of bulls but prices lack the follow up movement and got stuck in the consolidation. However, recently prices broke out with the higher volume which increases the sustainability of the breakout and traders may look for betting on the long side by keeping strict SL at the support levels.On the other hand, if bulls continued the momentum then $16.095 will act as the next barrier for the bulls.
FXS token technical indicators are turning bullish and price action is also favoring the same direction indicates that the prices are likely to trade with the bullish bias. However, if the price retrace downward then $8.191 will act as an immediate support level for the bulls. The MACD is preparing to generate a positive crossover whereas the RSI at 70 near to the overbought zone.
Summary
FXS token prices are in recovery mode and continuing the bullish momentum.The technical analysis suggests that the recent breakout looks sustainable and prices are likely to remain in the bulls grip. Therefore, traders may look for buy on dip opportunities near to the 50 day EMA for the target of $16.000 and above by keeping $8.000 as SL. However, if the price drops below $8.000 then it will trigger the bearish sentiment.
Technical levels
Resistance levels : $16.095 and $18.000
Support levels : $8.191 and $4.098
Disclaimer
The views and opinions stated by the author, or any people named in this article, are for informational purposes only, and they do not establish financial, investment, or other advice. Investing in or trading crypto assets comes with a risk of financial loss.

Nancy J. Allen is a crypto enthusiast, with a major in macroeconomics and minor in business statistics. She believes that cryptocurrencies inspire people to be their own banks, and step aside from traditional monetary exchange systems. She is also intrigued by blockchain technology and its functioning. She frequently researches, and posts content on the top altcoins, their theoretical working principles and technical price predictions.


