
 Home
Home News
News

- The AR coin price has stormed past the small-term supply zone on a daily time scale.
- AR coin price is forming a rounding bottom pattern on a daily time scale.
- The pair of AR/BTC is trading at the price level of 0.0005637 with an increase of 2 13% in the past 24 hours.
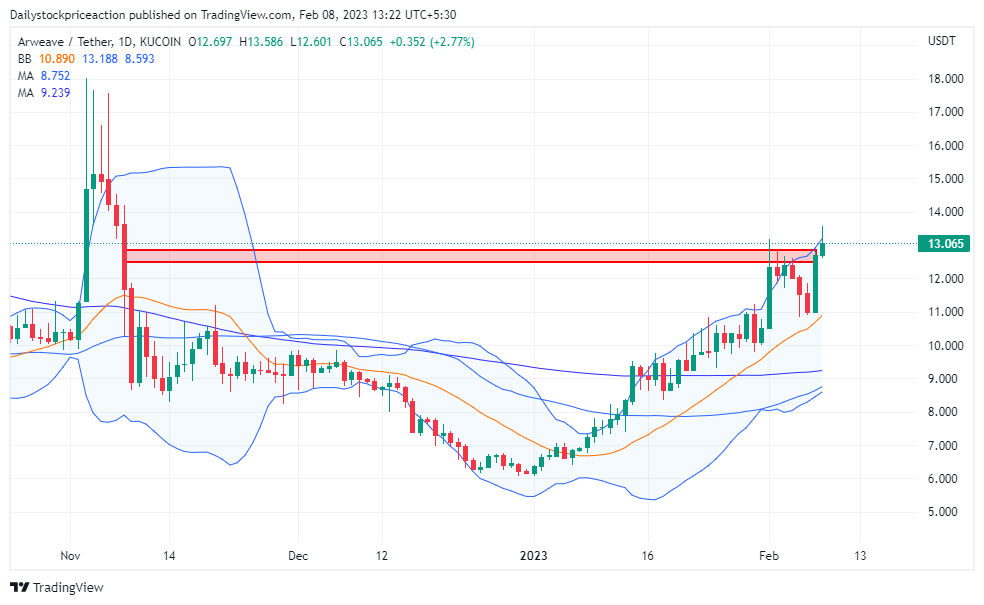
The AR coin price, as per the price action, is on a strong bullish run from the past couple of trading weeks. Recent movement has led to the AR coin price reaching the long-term supply zone on a daily time scale.

Currently, the AR coin price is trading above the 50 and 100 important Moving Averages. This comes after the coin price bounced off strongly from the demand zone which led to the breakout of the important MAs. This movement has resulted in a strong price structure formation. The AR coin price is forming higher high and higher low formations on a daily time scale. Moving upwards during the pullback in the bullish run, the coin price can be seen resting at these MAs.

The AR coin price is trading at the upper band of the Bollinger band indicator after bouncing off the lower band. The coin price is currently trading at the upper hand with a strong consolidation, and a breakout on either side will trigger a big movement. Volumes have also increased as the coin price showed a one-sided move. Therefore volatility has increased investors should wait for the decrease in volatility and then act accordingly.
The AR coin price is forming a rounding bottom pattern on a daily time scale
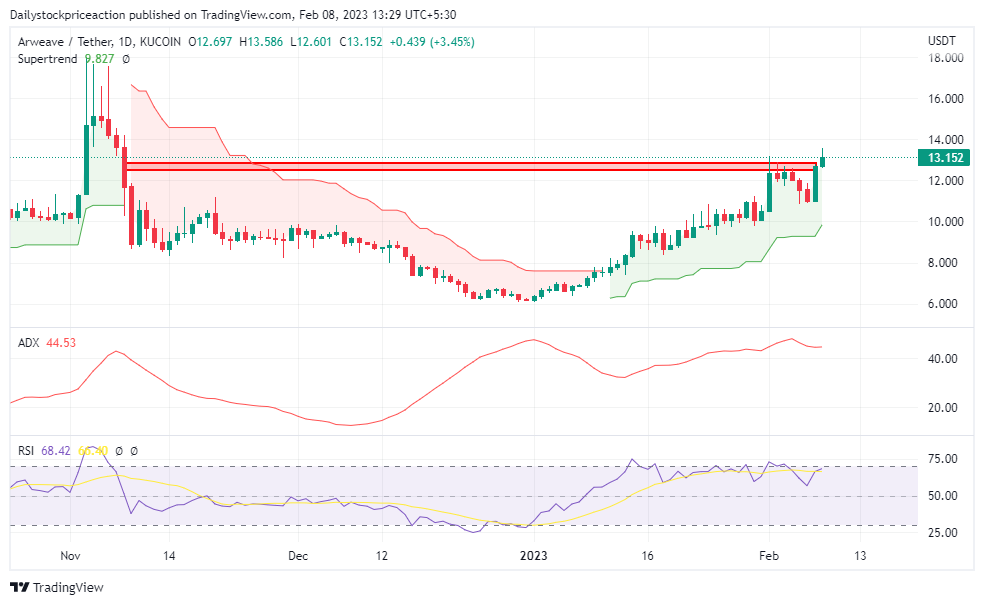
Average Directional Movement Index: ADX curve was trading below the 0-mark level as the coin price was failing to bounce off the demand zone. As the coin price bounced off the demand zone following the overall market bullishness. The AR coin price has been trading at the supply zone and as a result, the ADX curve has cooled off currently transacting at 50.55.
Supertrend: The AR coin price has been on a rise and the same is suggested by these technical parameters. Before the current bullish movement, the coin price was trading below the super trend sell line which was acting as a strong supply zone. However, the coin price has gone past the superintend sell line signalling a buy signal following the bullish momentum in the overall financial markets.
Relative Strength Index: RSI curve is trading at the level of 54.75. The RSI curve has crossed the halfway mark of 50. Once the coin gives a breakout of an ascending triangle pattern on a daily time frame, the RSI curve can be seen moving up. The RSI curve has crossed the 14 EMA yellow line indicating a short-term bullishness.
Conclusion: The AR coin price is bullish as the price action suggests. The technical parameters are also seen to support the price action as they turn bullish. It remains to see if the coin price will break the supply zone or fall below facing strong resistance from the supply zone.
Support: $10.50 and $9.80
Resistance: $14.50 and $15.70
Disclaimer
The views and opinions stated by the author, or any people named in this article, are for informational purposes only, and they do not establish financial, investment, or other advice. Investing in or trading crypto assets comes with a risk of financial loss.

Andrew is a blockchain developer who developed his interest in cryptocurrencies while pursuing his post-graduation major in blockchain development. He is a keen observer of details and shares his passion for writing, along with coding. His backend knowledge about blockchain helps him give a unique perspective to his writing skills, and a reliable craft at explaining the concepts such as blockchain programming, languages and token minting. He also frequently shares technical details and performance indicators of ICOs and IDOs.


