
 Home
Home News
News

- FXS token price has bounced off the demand ozone indicating a strong bullish pressure on a daily time frame.
- The token price is forming a Flag and pole pattern on daily time scale.
- The pair of FXS/BTC is trading at the price level of 0.0002517 with a decrease of 1.28% in the past 24 hours.
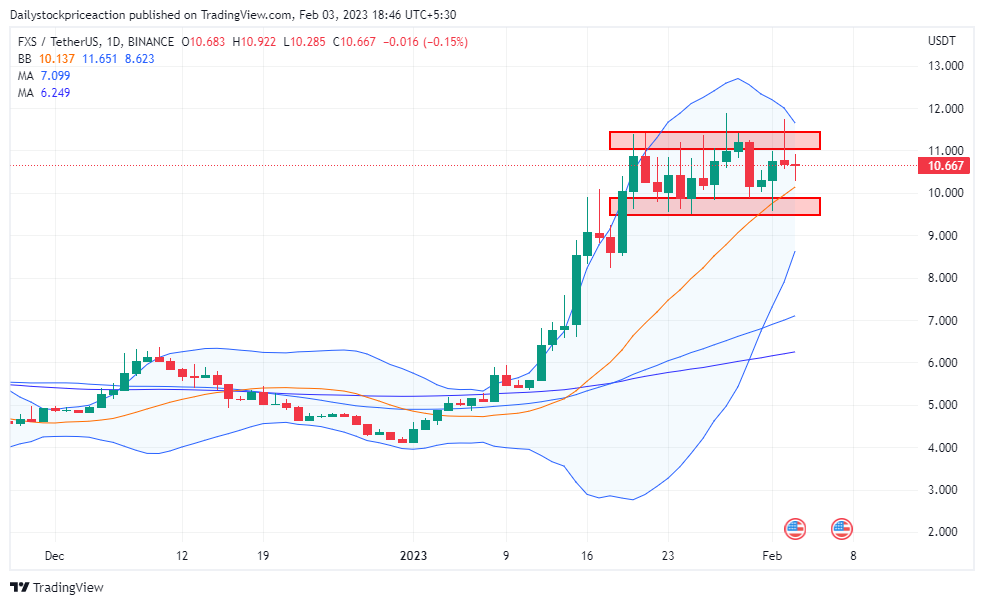
The FXS token price as per the price action has surpassed every small term supply zone and currently it is trading at the long term supply zone on a daily time frame. This comes after the token price jumped off the demand zone with a strong momentum.

On a daily time scale, the token price is in a bullish mode and is consolidating near the supply zone indicating a great conviction for the upcoming bullish trend. The token price was previously facing a strong rejection from the important moving averages. But recent bounce off the support zone has resulted in the token price crossing the important 50 and 100 Moving Averages. Moving upwards the token price can be seen taking rest at these MAs.

The FXS token price is currently in a strong consolidation on a smaller time frame(hourly) and breakout on either side will trigger a big move. At present, the FXS token price is trading at the upper band of the bollinger band indicator and it has also crossed the 14 SMA. Volumes have increased causing the token price to show an erratic movement although the investor should not get carried away by this movement and wait for a proper breakout on the supply zone on a daily time frame and then act accordingly.
FXS token price is forming a Flag and pole pattern on daily time frame
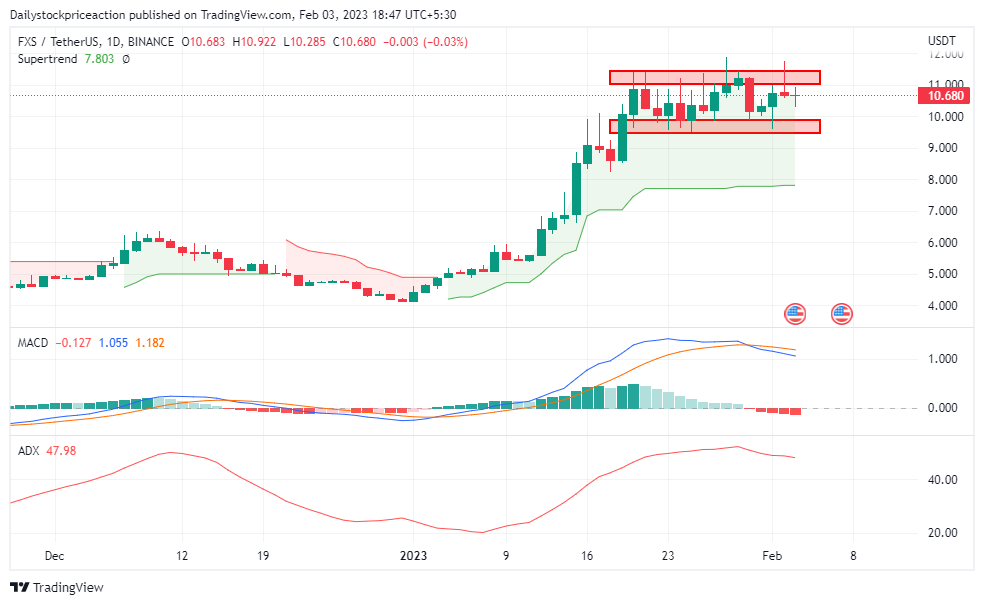
Moving Average Divergence Convergence: The FXS token price was bearish prior to the recent rise and was trading the the bottom on a daily time frame. Recent bounce has resulted in the MACD indicator triggering a bullish signal. The blue line crossed the red line on the upside indicating a strong momentum. Once the token price breaks the supply zone , the MACD lines can be seen widening supporting the trend.
Average Directional Movement Index: ADX curve was trading below the 20 mark level as the token price was failing to bounce off the demand zone. As the token price bounced off the demand zone following the overall market bullishness. The FXS token price has been trading at the supply zone and as a result the ADX curve has cooled off, currently transacting at 47.88
Supertrend: The FXS token price has been on a rise and the same is suggested by these technical parameters. Before the current bullish movement, the token price was trading below the supertrend sell line which was acting as a strong supply zone. However, the token price has gone past the supertend sell line signalling a buy signal following the bullish momentum in the overall financial markets.
Conclusion: The FXS token price has been on a staggering bullish momentum and the same is depicted by the price action, the technical parameters are also bullish suggesting a strong bullish movement in the upcoming trading days if the token price breaks the supply zone. Investors should remain cautious and wait for a clear break out of the supply zone and then act upon.
Support: $9.5 and $9.1
Resistance: $11.3 and $12.9
Disclaimer: The views and opinions stated by the author, or any people named in this article, are for informational purposes only, and they do not establish financial, investment, or other advice. Investing in or trading crypto assets comes with a risk of financial loss.

Nancy J. Allen is a crypto enthusiast, with a major in macroeconomics and minor in business statistics. She believes that cryptocurrencies inspire people to be their own banks, and step aside from traditional monetary exchange systems. She is also intrigued by blockchain technology and its functioning. She frequently researches, and posts content on the top altcoins, their theoretical working principles and technical price predictions.


