
 Home
Home News
News
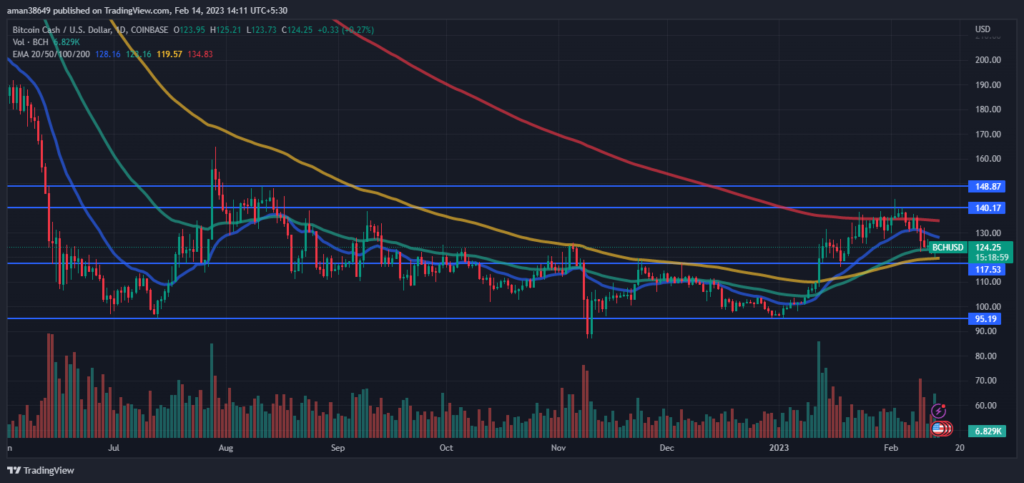
- Bitcoin Cash was currently at $124.34 with an increase of 0.54% during the intraday trading session.
- The 24-hour low of BCH was $120.57 and the 24-hour high of BCH was $124.92.
- The current Zcash price is above 50, and 100-Days EMA.
The current price of Bitcoin Cash was around $124.34 with an increase of 0.54% during the intraday trading session. The pair of BCH/BTC was currently trading at 0.005718 BTC with a rise of 0.94% over the intraday trading session.
Bitcoin cash price prediction suggests that BHC is in a downtrend. Since the start of 2023, Bitcoin Cash was on an uptrend previously but at the start of Feb 2023, it started going in a downtrend. At the start of the Feb, we can see the evening star candlestick pattern over the daily trading chart which indicates a strong trend reversal. This shows that BHC is under the pressure of sellers which has caused it to drop near its primary resistance of 117.53. This indicates that sellers have taken over the market and are trying to push BCH further down. Currently, buyers are trying to take the market from sellers and trying to push Bitcoin Cash further up. If 20-days EMA makes a negative crossover with 50 and 100-days EMA then it suggests that sellers have total control over the market. To save from that happening buyers should come to the rescue of BCH and try to take the market from sellers.
The volume of the coin has increased by 0.38% in the last 24 hours. The increase in volume indicates that the number of buyers has increased. That means there is a relationship between the trading volume and the price of BCH, this signals strength in the current bullish trend. The coin’s price is heading above the 50, and 100-day daily moving averages.
The technical analysis of Bitcoin Cash:
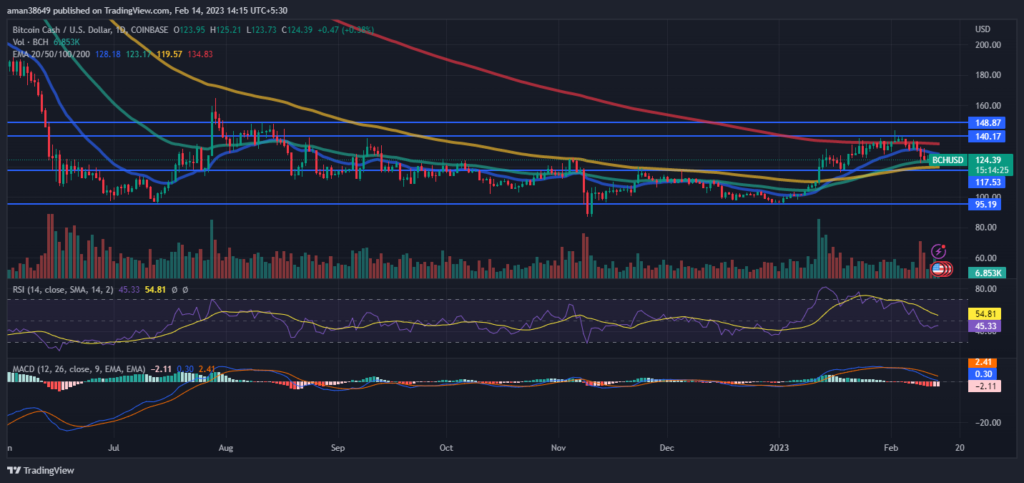
RSI is not showing any definitive crossover and is declining in the oversold zone which will indicate that sellers and buyers both are in a stalemate and trying to take back the market. The current value of RSI is 45.21 which is below the average RSI value of 54.80.
The MACD and MACD signals are intersecting and also not giving any definitive crossover over the intraday trading session. Investors are watching every move in the market carefully.
Conclusion
Bitcoin Cash is in a downtrend. Previously it was in an uptrend sense at the start of 2023 but after the appearance of the evening star pattern over the daily trading chart, it is in a downtrend. But buyers are trying to take back the market from sellers. The increase in price and volume indicates the buyer’s confidence in BCH. RSI is in the oversold zone but rising which indicates that buyers are coming and MACD is not giving any definitive crossover as per the technical indicators.
Technical Levels-
Resistance level- $140.17 and $148.87
Support level- $117.53 and 95.19
Disclaimer-
The views and opinions stated by the author, or any people named in this article, are for informational purposes only, and they do not establish financial, investment, or other advice. Investing in or trading crypto assets comes with a risk of financial loss.
Steve Anderson is an Australian crypto enthusiast. He is a specialist in management and trading for over 5 years. Steve has worked as a crypto trader, he loves learning about decentralisation, understanding the true potential of the blockchain.


