
 Home
Home News
News
- VET has entered an uptrend by continuously forming higher highs and higher lows.
- RSI indicator generates a buy signal for the coin.
- A breakout of an ascending triangle pattern seems to be on the way on daily chart.
Technical analysts may have observed a downfall in prices of coin for a long time and may have also noticed that this downfall stopped after reaching the support level from where price reversed and showed a bull move.
An ascending triangle pattern may have also been spotted by investors on daily chart. The coin has tried to give a breakout of the pattern multiple times but has failed every time. Moreover, the level at which coin is currently trading is one of its resistance levels.

Will an ascending triangle pattern breakout take place?
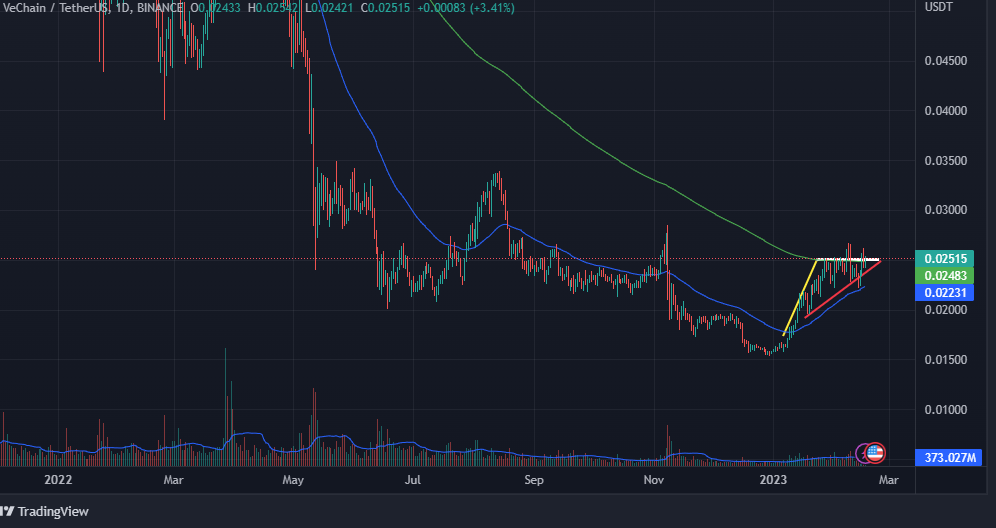
On a daily chart, a breakout of an ascending pattern is anticipated.The trendline marked with white color on the chart is acting as coin’s current resistance . A sharp increase in prices may be seen after coin breaks this resistance. Moreover, 50 EMA (white line)
also seems to be approaching 200 EMA (green line). Therefore, if 50 EMA crosses 200 EMA from below, a Golden Crossover may take place which may then lead to a further increase in prices of the coin.

The MACD indicator appears to be on verge of giving a bullish crossover. The histograms of the MACD indicator are also turning light red in color which indicates that bears are waning and that soon bulls may take over bears. On other hand, RSI curve is currently trading above its 50-point level at 57.41. The value of the RSI curve may be seen rising once the coin’s price increases.
Overall, the MACD indicator is currently neutral while RSI indicator is delivering a buy signal.
Will coin break the resistance to show a bull move?

On the short-term chart, investors may have noticed the coin facing resistance around $0.02675. The coin has shown a pull back multiple times from those levels. This indicates that those levels are one of a coin’s strong resistance and if Vet coin breaks that resistance, a bull run may be seen. Moreover, a Golden Crossover also occurred on short-term chart previously around major support level, that is around $0.01574 from where coin showed a great bull run to the present price levels.
Conclusion
Investors may have come to the conclusion that breakout of an ascending triangle pattern may lead to a bull run. Moreover, they also expect that a Golden Crossover may take place on the daily chart after pattern breakout.
Technical Levels
Resistance levels – $0.02675 and $0.03361
Support levels – $0.01795 and $0.01554
Disclaimer: The views and opinions stated by an author, or any people named in this article, are for informational purposes only, and may not establish financial, investment, or any other financial advice. Investing in or trading crypto assets comes with a risk of financial loss.
Steve Anderson is an Australian crypto enthusiast. He is a specialist in management and trading for over 5 years. Steve has worked as a crypto trader, he loves learning about decentralisation, understanding the true potential of the blockchain.


