
 Home
Home News
News
- HBAR coin can be seen fluctuating between a range of $0.0928 and $0.0830 at current price levels.
- RSI indicator is currently providing a buy signal for coin.
- A Golden Crossover seems to be taking place soon on daily chart.
Technical analysts may have observed that coin after a significant downfall fluctuated within a range for several months. HBAR recently showed a bull move from its support levels and is now trading at those levels which is acting as a key resistance for it. The coin has reversed multiple times from these levels, therefore it will be interesting to watch how it reacts this time.
Will coin gave a bull rally after breaking the consolidation zone?
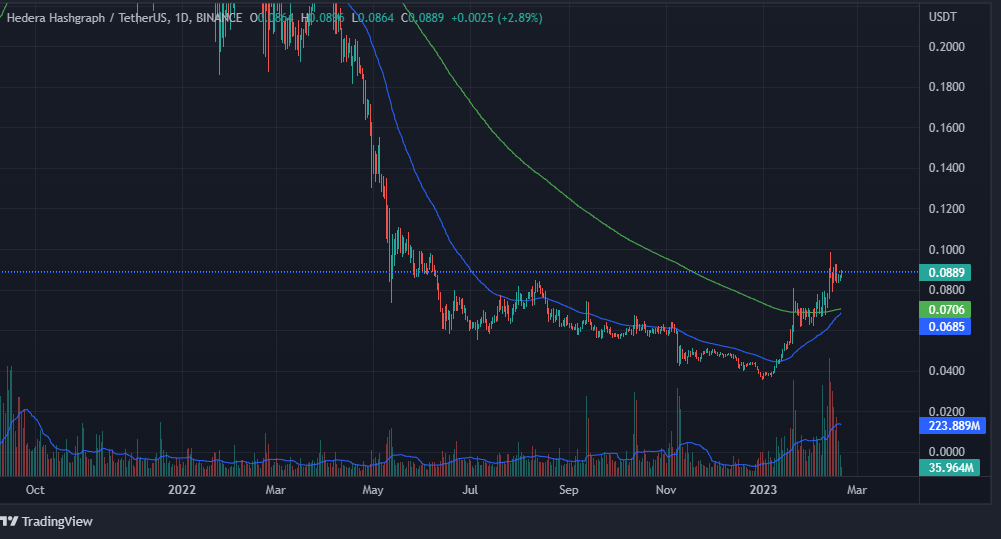
On daily chart, investors might have noticed that coin is presently consolidating in a zone at current price levels. It is expected that if coin breaks this zone on upside, investors may see a strong bull run. But other than this, there are other possibilities too where instead of a breakout and increase in prices, coin may show a down move which may then lead to decline in prices. Moreover, a Golden Crossover seems to be approaching on daily chart which is a positive signal because this crossover may increase the prices of coin.
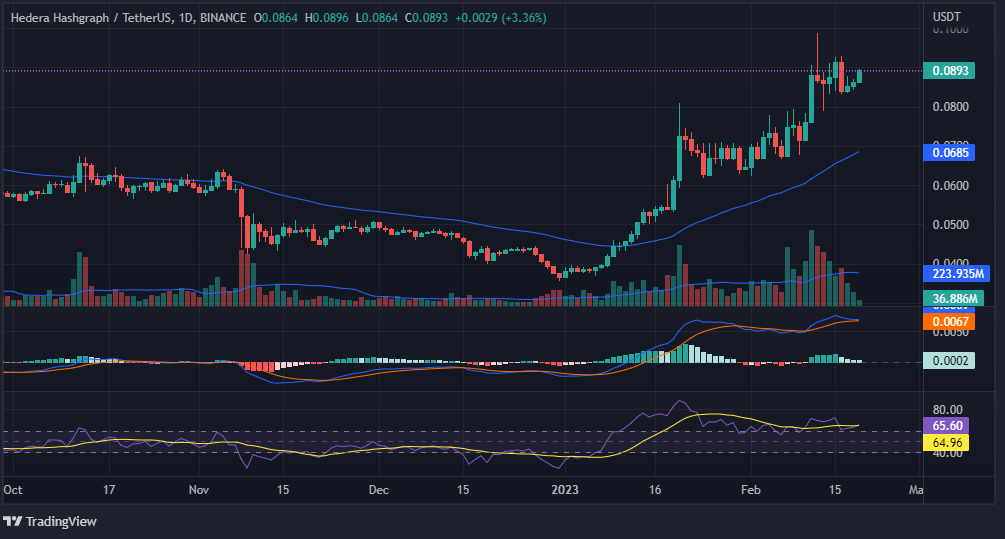
MACD indicator has displayed a bullish crossover earlier. This bullish crossover indicated that bulls have gained an upper hand over bears but presently this bullish crossover seems to be fading because of its histograms turning light green in color. Therefore, there are chances that a slight downfall in prices may lead to a bearish crossover.
On other hand, RSI curve is trading at 65.60 which is over and above its 50-point threshold. As soon as the price of coin increases, RSI curve’s value may be seen increasing.
Therefore, it can be clearly seen that MACD indicator is neutral whereas RSI indicator is generating a buy signal.
Will the bull rally continue on short-term chart?
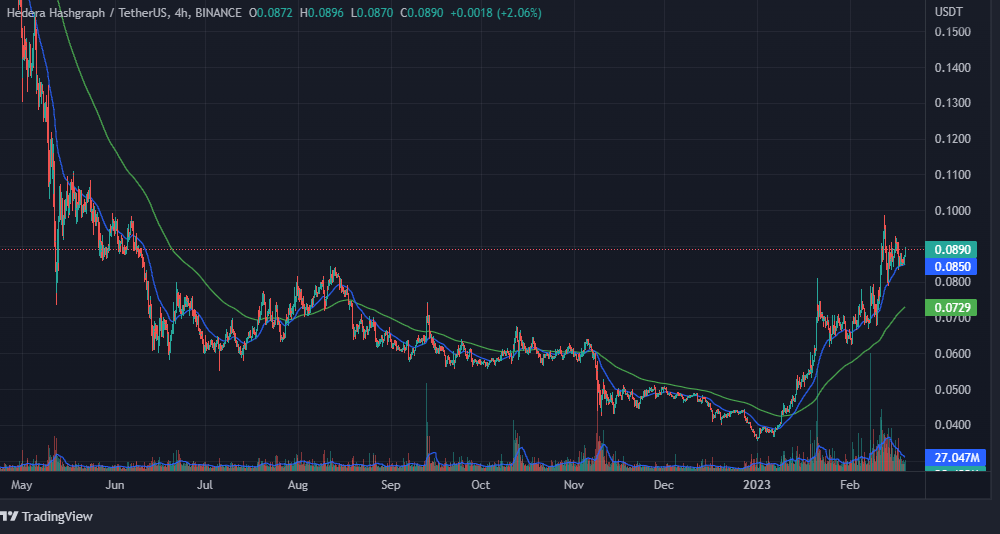
The short-term chart price movement is similar to that of daily chart. The only difference that can be spotted is that Golden Crossover which has not yet taken place on daily chart has already taken place on short-term chart around the support levels.
Conclusion
Investors might have concluded that the Golden Crossover that may be taking place on daily chart soon may act as one of the strong confirmation in coin’s bull rally in near future.
Technical Levels
Resistance levels – $0.0933 and $0.1067
Support levels – $0.0632 and $0.0385
Disclaimer: The views and opinions stated by an author, or any people named in this article, are for informational purposes only, and may not establish financial, investment, or any other financial advice. Investing in or trading crypto assets comes with a risk of financial loss.

Andrew is a blockchain developer who developed his interest in cryptocurrencies while pursuing his post-graduation major in blockchain development. He is a keen observer of details and shares his passion for writing, along with coding. His backend knowledge about blockchain helps him give a unique perspective to his writing skills, and a reliable craft at explaining the concepts such as blockchain programming, languages and token minting. He also frequently shares technical details and performance indicators of ICOs and IDOs.


