
 Home
Home News
News
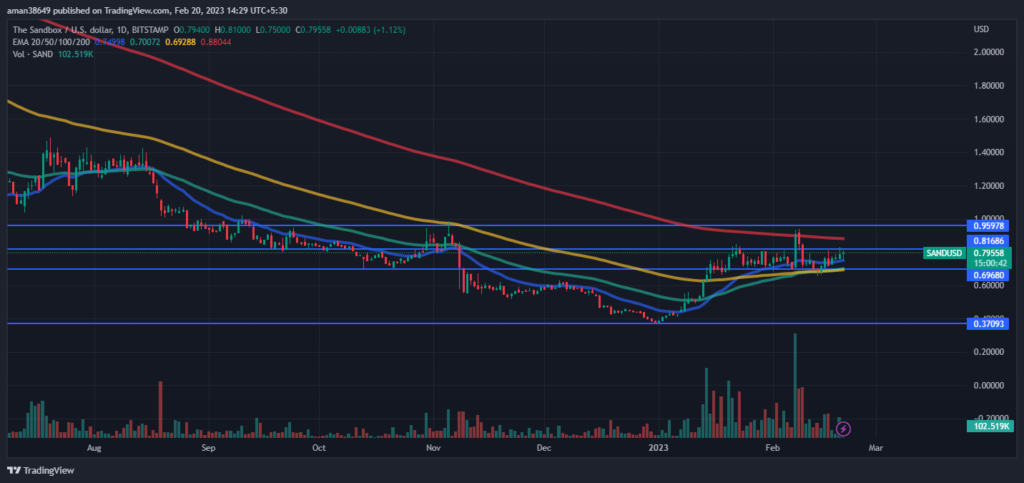
- The Sandbox was currently at $0.8045 with an increase of 4.58% during the intraday trading session.
- The 24-hour low of SAND was $0.7592 and the 24-hour high of SAND was $0.8289.
- The current Sandbox is above 20, 50, and 100-Days EMA.
The pair of SAND/BTC was currently trading at 0.00003286 BTC with a rise of 5.38% over the intraday trading session.
The Sandbox price analysis suggests that currently it is in an uptrend. For SAND 2022 was very volatile and was not a good year as SAND was in a downtrend trend even though buyers tried their best to push SAND upwards but sellers pressured SAND and push down forcing it to make its all-time low on the last day of 2022. But after the start of 2023, SAND started rising constantly which indicates that buyers were in majority in the market after reaching its primary resistance of $0.816 SAND became stranded and started consolidating between its primary resistance and its primary support of $0.696.
Buyers were in majority in the market and pushed SAND upwards reaching its secondary resistance but then sellers pushed SAND downwards reaching its primary support then buyers again pushed SAND upwards but the appearance of a shooting star candlestick pattern over the daily trading chart indicates that the price could now fall and sellers could take back the market from buyers.
The volume of the coin has increased by 136.58% in the last 24 hours. The increase in volume indicates that the number of buyers has increased. This shows that buyers are trying their best and there is a relationship between volume and the price of SAND, which represents strength in the current trend.
The technical analysis of The Sandbox
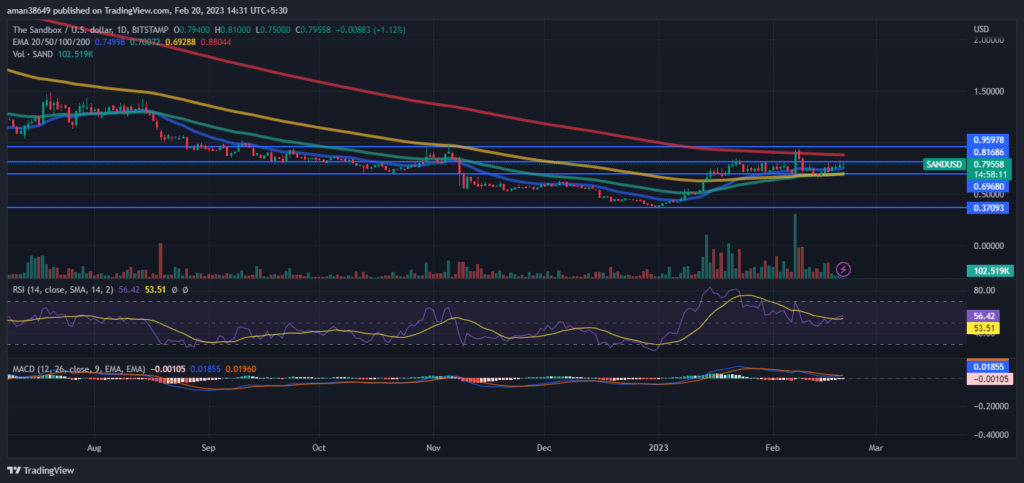
RSI is increasing in the overbought zone and has shown signs of a positive crossover which indicates that the bulls are coming in the majority and taking back the market from bears and pushing SAND downwards. This suggests the strength of the current uptrend. The current value of RSI is 56.42 which is above the average RSI value of 53.51.
The MACD and signal are decreasing and intersecting but not giving any definitive crossover. Investors are watching every move in the market carefully.
Conclusion
The Sandbox price analysis suggests that SAND is currently in an uptrend. 2022 was a rough year for SAND as it was declining throughout the year and on the last day of 2022, SAND made its all-time low. But after the start of 2023, SAND started rising but after reaching its primary resistance it started consolidating now buyers are coming in the majority and pushing SAND upwards. The increase in volume shows the strong market sentiment towards SAND. RSI has also shown signs of positive crossover and MACD is declining but not giving any definitive evidence to support RSI and the current uptrend, as per technical indicators.
Technical Levels-
Resistance level- $0.816 and $0.959
Support level- $0.696 and $0.370
Disclaimer-
The views and opinions stated by the author, or any people named in this article, are for informational purposes only, and they do not establish financial, investment, or other advice. Investing in or trading crypto assets comes with a risk of financial loss.

Nancy J. Allen is a crypto enthusiast, with a major in macroeconomics and minor in business statistics. She believes that cryptocurrencies inspire people to be their own banks, and step aside from traditional monetary exchange systems. She is also intrigued by blockchain technology and its functioning. She frequently researches, and posts content on the top altcoins, their theoretical working principles and technical price predictions.


