
 Home
Home News
News
- SAND is currently consolidating within a narrow range
- SAND might take rejection from the 200 EMA
- Prices may form a bullish movement
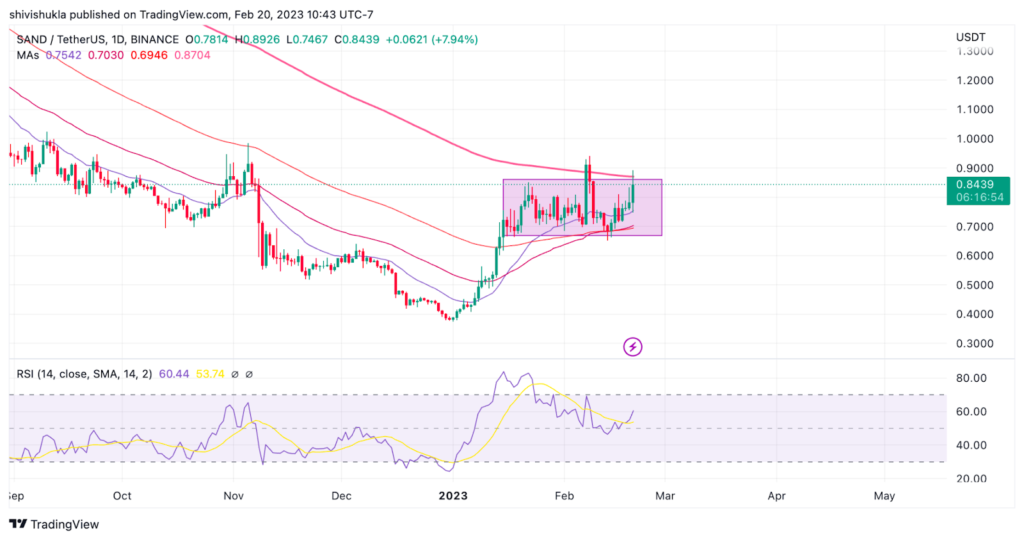
While the sand gave us an extremely bullish move of 82% in early January currently the investors are indecisive towards its upcoming direction. As of now, SAND is consolidating within a narrow range giving 24% on each move although this range is yet to be broken it is giving main indications of giving us a downward move. The current price of the sandbox is $0.84 with a change in the 24-hour volume of 102%. Sandbox is up at 8.2% in the last 24 hours.
Sandbox consolidating within a range
SAND is consolidating within a range under the 200 EMA while taking support from the 100 EMA. After being under the influence of the bears it seems like SAND is looking to change its trend although the road ahead seems to be filled with obstacles. Sandbox is a blockchain-based virtual world where users can exchange and create things in the form of games. Also recently Paris Hilton “Queen of metaverse” has created a month-long dating game in the Sandbox.
Technical Analysis (1-day timeframe)
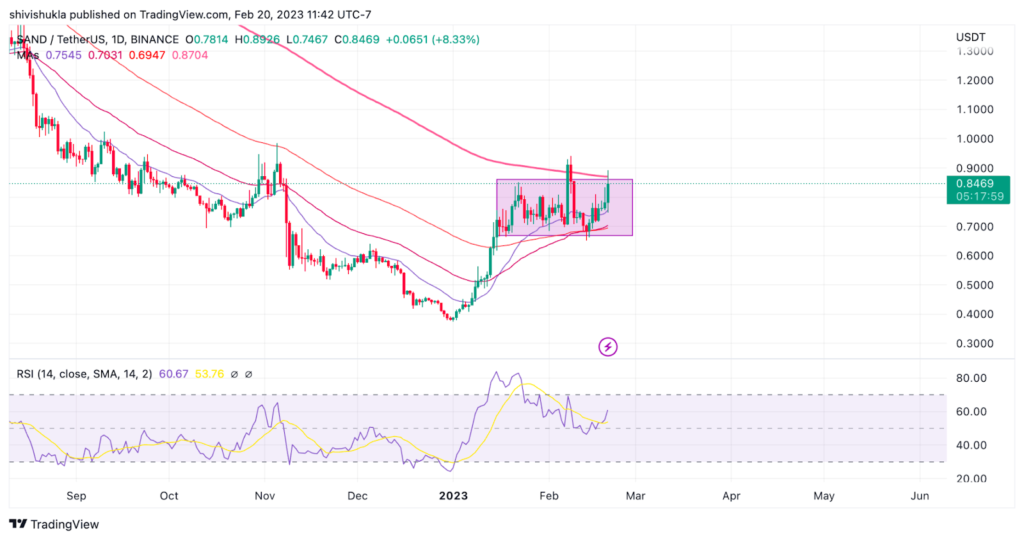
SAND is currently trading right under the 200 EMA while we are also getting a golden crossover between the 100 and 50 EMA. Also while taking resistance from the 200 EMA Sandbox is also taking resistance from the 100 EMA. As of now, the SAND price is constantly testing its 200 EMA looking for a breakout.
The sand price is currently consolidating within the narrow price range of $0.8607 to $0.6688 over the last two months. A consolidation channel is usually an indicator of either a change in trend or a continuation of a trend where the price breaks out of the consolidation pattern with a strong momentum deciding the way the trend might continue towards.
The RSI is giving us an indication of a bearish correction where the price is consolidating within a range the RSI is making consistent lower highs and lower lows. The current RSI value is 60.16 which is taking rejection from the 14 SMA.
Conclusion –
From the above analysis SAND price is consolidating within a range that might break out soon. It can not be predicted from the price action alone in which direction the price might go and can clearly take an estimate from the technical indicators EMA and RSI that SAND might start making a bearish correction as RSI is trending from the overbought to oversold levels and the 200 EMA is giving critical resistance to SAND currently.
Technical levels –
Support – $0.7000
Resistance -$ 0.9050
Disclaimer
The views and opinions stated by the author, or any people named in this article, are for informational purposes only, and they do not establish financial, investment, or other advice. Investing in or trading crypto assets comes with a risk of financial loss.

With a background in journalism, Ritika Sharma has worked with many reputed media firms focusing on general news such as politics and crime. She joined The Coin Republic as a reporter for crypto, and found a great passion for cryptocurrency, Web3, NFTs and other digital assets. She spends a lot of time researching and delving deeper into these concepts around the clock, and is a strong advocate for women in STEM.


