
 Home
Home News
News
- XTZ might take a 14% drawdown in the upcoming days
- XTZ is taking critical resistance from the 200 EMA
While being on the extremely bullish move for the last couple of days Tezos is giving us some indications that it might take a correction of 14%. The technical analysis is suggesting that this optimism might soon come to an end although, in the long term view, chances are that after the short correction, XTZ might continue its bull trend. The current price of Tezoz is $1.22 with a change in the 24-hour trading volume of 24.37%. Tezoz’s price is down 2.17% in the last 24 hours.
XTZ taking resistance from the 200 EMA
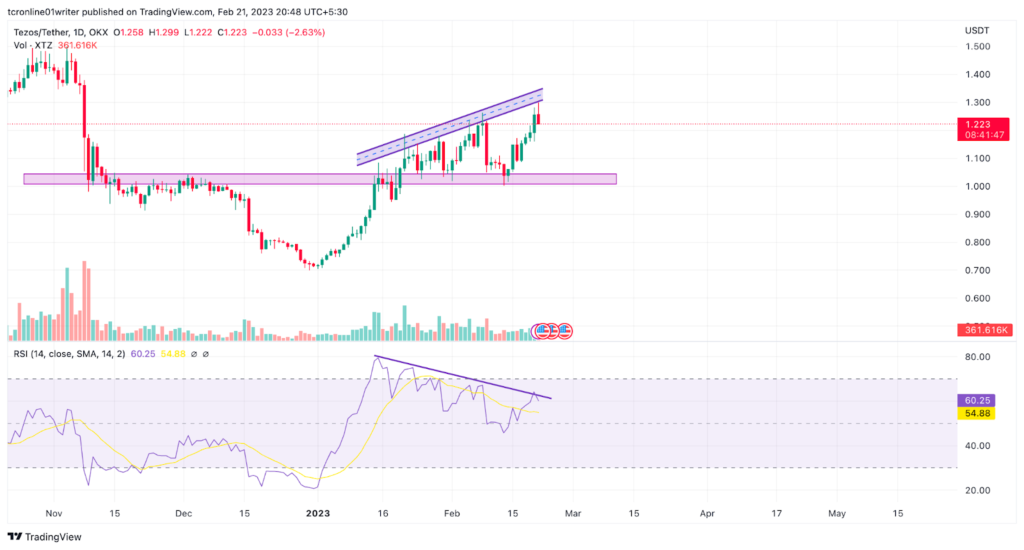
In recent days XTZ token has been trading in an extremely bullish trend after being under a vicious bearish trend XTZ made a comeback of 45% and took a brief resistance from a level of $1.044 Tezos broke it with a strong bullish candle after taking support from this resistance level twice and giving a golden crossover from major key averages XTZ is currently taking resistance from its next key average 200 EMA.
Technical Analysis ( 1 Day timeframe )
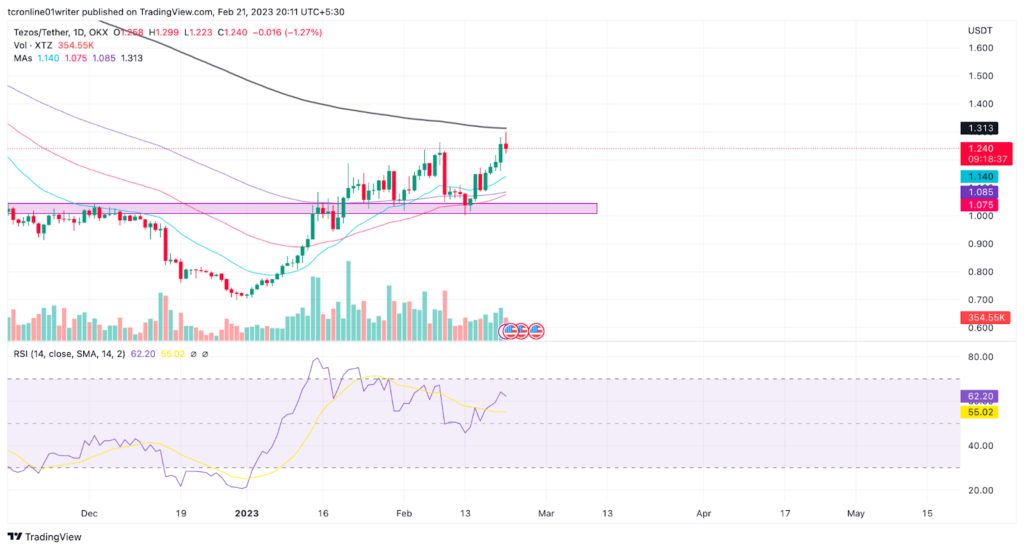
EMA’s – Tezos after crossing the 20 and 50-day EMA with a strong bullish move XTZ took resistance from the 100 EMA but XTZ again took support from the 50 EMA XTZ price crossed the 100 EMA. Currently, Tezoz is taking support of its previous resistance 100-day EMA while retesting its next critical resistance 200 EMA the making of the red candle is suggesting that Tezos might soon successfully take drawdown from its current resistance.
Support and Resistance – The current resistance for the Tezoz coin is near the price of $1.344 while its most recent support is 15 percent below the current price near the level of $ 1.049.
RSI – The RSI line is trading under the overbought around point 61.61 consistently making lower highs and lower lows. The RSI curve is suggesting that the RSI line might soon start moving toward the oversold levels. The RSI is also making a divergence with the price action where the price of Tezos is going sideways but the RSI is going downwards which suggests that the price might soon be moving toward the demand zone.
Conclusion
As we can conclude from the above analysis after being on a bullish move for the last couple of days bears might take the control of the trend. Tezoz is currently taking critical resistance from the 200 EMA while RSI divergence is also giving a signal toward the upcoming bear trend.
Technical levels –
Support – $ 1.049
Resistance – $ 1.344
Disclaimer
The views and opinions stated by the author, or any people named in this article, are for informational purposes only, and they do not establish financial, investment, or other advice. Investing in or trading crypto assets comes with a risk of financial loss.

With a background in journalism, Ritika Sharma has worked with many reputed media firms focusing on general news such as politics and crime. She joined The Coin Republic as a reporter for crypto, and found a great passion for cryptocurrency, Web3, NFTs and other digital assets. She spends a lot of time researching and delving deeper into these concepts around the clock, and is a strong advocate for women in STEM.


