
 Home
Home News
News
- TWT price is showing optimism in the otherwise bearish conditions
- Trust wallet token might take a pullback from the 200 EMA
- TWT coin is consolidating near 200 EMA as of now
Trust Wallet Token has been getting positive support from buyers recently also TWT has not closed below the 200 EMA in the last 8 months when the overall market was suffice to say trending below it. These indications show that the buyers are supporting this token. The current price of TWT is $1.46 with a change in the 24-hour volume of 156%. TWT is down 2.34% in the last 24 hours.
TWT consolidating above the 200 EMA
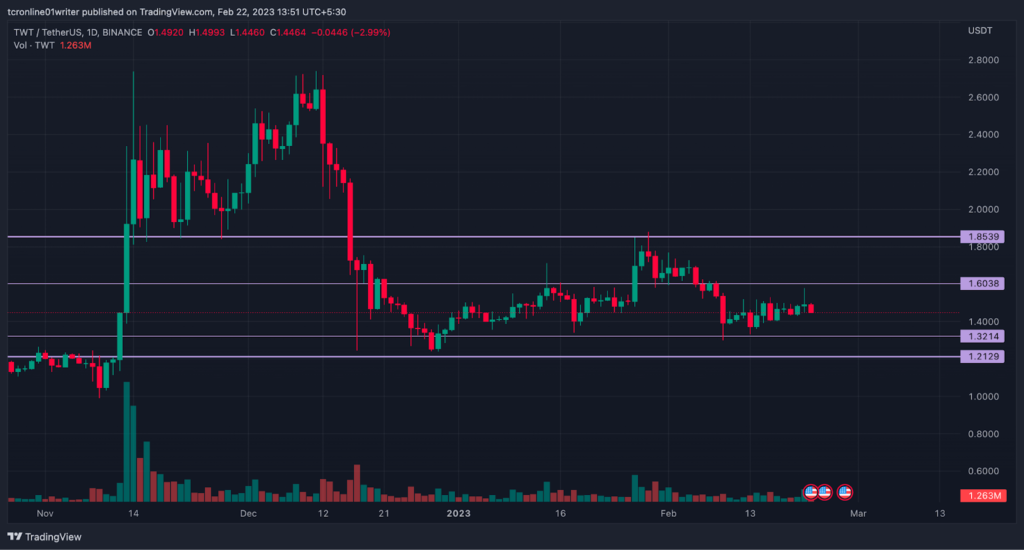
TWT after a strong bearish move near mid-December has been consolidating within a narrow range after testing its current resistance TWT price tried to break its current resistance but could not succeed. As of now, there seems to be some indecision in the market between the bears and the bulls the upcoming trend of TWI will be decided once this consolidation level will be broken in a particular direction indicating that either the buyers are supporting the price or rejecting it.
Technical Analysis ( 1 Day Timeframe)
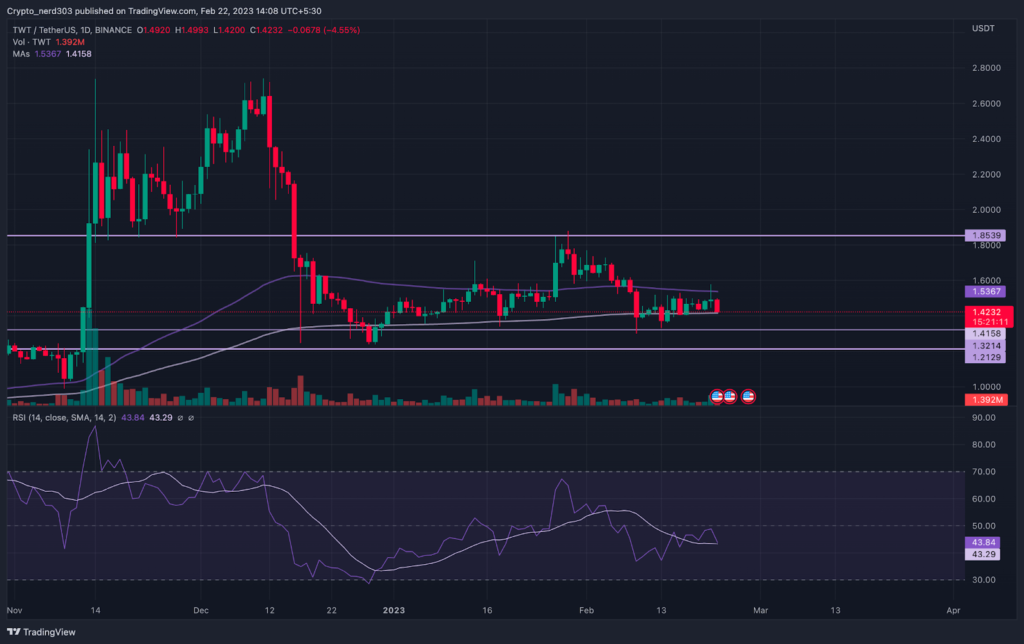
EMA’s – After making quite a few attempts to break out TWT’s current major resistance 100 EMA Trust Wallet Token is moving within the range of 100 EMA and 200 EMA where the 100 EMA is providing resistance to TWT and 200 EMA are providing support. It is a favorable situation for TWT as this narrow channel is building pressure for TWT indicating a big move while TWT has not closed below the 200 EMA in the last eight months.
Support and Resistance – TWT is currently taking support from the 200 EMA near the price of $ 1.4149 while its next recent support 8% below the current price is at a level of $1.3214 TWT’s recent resistance is around the price of $ 1.5371 while its next resistance is 30% above the current price around level $1.8000.
RSI – The RSI indicator is currently trading below the median line taking support from the 14 SMA the RSI curve suggests that it might soon start moving toward the supply zone while taking support from the 14 SMA.
Conclusion –
As it can be concluded from the above analysis TWT is currently moving within a narrow consolidation channel which often happens when the price is preparing for a big move while the price is taking support from the 200 EMA when it has not given a close below it since the last 8 months where TWT is also taking resistance from the 100 EMA. In this case, the support is stronger than the resistance which provides TWT with a decent advantage of breaking the resistance
Technical levels –
Support – $ 1.4149 and $1.3214
Resistance – $ 1.5371 and $1.8000.
Disclaimer
The views and opinions stated by the author, or any people named in this article, are for informational purposes only, and they do not establish financial, investment, or other advice. Investing in or trading crypto assets comes with a risk of financial loss.
Steve Anderson is an Australian crypto enthusiast. He is a specialist in management and trading for over 5 years. Steve has worked as a crypto trader, he loves learning about decentralisation, understanding the true potential of the blockchain.


