
 Home
Home News
News
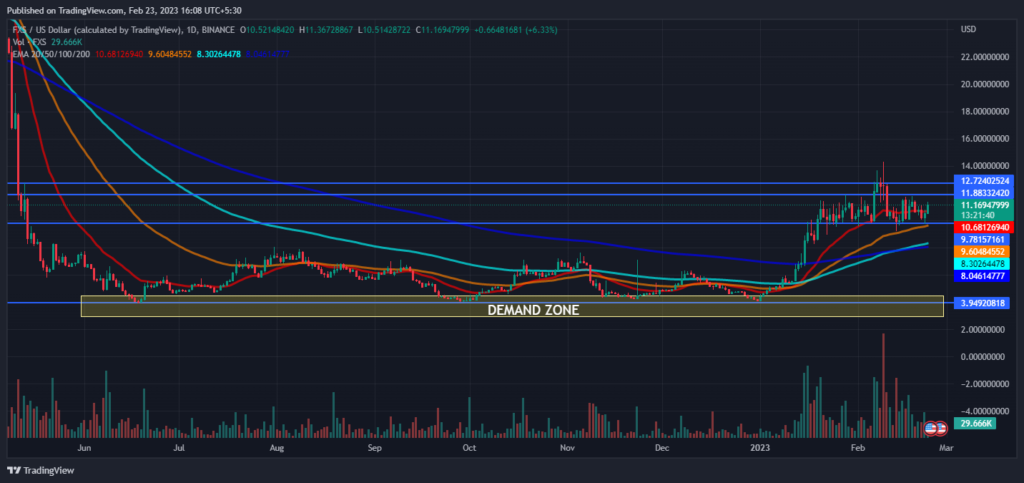
- 1 Frax Share was currently at $11.12 with an increase of 12.41% during the intraday trading session.
- 2 The 24-hour low of FXS was $1.11 and the 24-hour high of FXS was $1.24.
- 3 The current Frax Share price is above 20, 50, 100, and 200-Days EMA.
The pair of FXS/BTC was currently trading at 0.0004565 BTC with a rise of 11.64% over the intraday trading session.
Frax Share price analysis suggests that it is currently in a bullish phase. From starting of 2022 FXS was declining which indicates that the sellers were in control of the market. And after May 2022 sellers pushed FXS into a consolidation phase and it remained until the start of 2023. Bears pushed FXS down to its demand zone multiple times before 2023. After the start of 2023, FXS started rising but after breaking its primary support of $9.781 FXS became stranded near its primary resistance and started consolidating between its primary support and resistance.
With the appearance of bullish marubozu candlestick buyers tried to break out of consolidation and even reached its secondary resistance of $12.724. But after the formation of a long-legged doji candlestick over the daily trading chart sellers push back FXS below its primary resistance which showed that the previous breakout was a false breakout This indicates that the market is very volatile and FXS can go in either direction up or down.
The volume of the coin has increased by 98.64% in the last 24 hours. The increase in volume indicates that the number of buyers has increased. This shows that buyers are trying their best and there is a relationship between volume and the price of FXS, which represents strength in the current trend.
The technical analysis of Frax Share

RSI is increasing in the overbought zone and has shown signs of a positive crossover which indicates that the buyers are coming in the majority and taking back the market from sellers and pushing FXS downwards. This suggests the strength of the current bullish trend. The current value of RSI is 54.43 which is above the average RSI value of 51.77.
The MACD and the signal line are increasing and intersecting nut not give any definitive evidence to support RSI. Investors need to watch every move over the charts during the day’s trading session.
Conclusion
Frax Share price analysis suggests that FXS is currently in a bullish phase. After May 2022 sellers pushed FXS into consolidation and forced FXS to enter its demand zone multiple times. After the start of 2023, FXS was constantly rising but after breaking its primary support FXS became stranded and started consolidating. The increase in volume shows the positive market sentiment towards FXS. RSI has a positive crossover which indicates strength in a bullish trend and MACD has been indecisive over the chart, as per technical indicators.
Technical Levels-
Resistance level- $11.883 and $12.7240
Support level- $9.781 and $3.949
Disclaimer
The views and opinions stated by the author, or any people named in this article, are for informational purposes only, and they do not establish financial, investment, or other advice. Investing in or trading crypto assets comes with a risk of financial loss.

Nancy J. Allen is a crypto enthusiast, with a major in macroeconomics and minor in business statistics. She believes that cryptocurrencies inspire people to be their own banks, and step aside from traditional monetary exchange systems. She is also intrigued by blockchain technology and its functioning. She frequently researches, and posts content on the top altcoins, their theoretical working principles and technical price predictions.


