
 Home
Home News
News

- 1 Flow token was currently at $1.22 with a decrease of 3.61% during the intraday trading session.
- 2 The 24-hour low of FLOW was $1.20 and the 24-hour high of FLOW was $1.28.
- 3 The current Flow token price is above 20, 50, 100, and 200-Days EMA.
The pair of FLOW/BTC was currently trading at 0.00005125 BTC with a dip of 1.54% over the intraday trading session.

Flow price analysis suggests that it is currently in a bearish phase. 2022 can be said that it was not a good year for FLOW as it was in a downtrend from the start of 2022 till May 2022, After many bulls tried to pick FLOW back up after reaching its supply zone sellers push FLOW back down. Because of this FLOW entered its supply zone multiple times but after entering it was pushed down by sellers each time. At the end of 2022, sellers forced FLOW to even break t primary support and pushed FLOW to make its new 52-week low. But after the start of 2023 FLOW started rising but after breaking its primary support of $0.984 FLOW became consolidated between its primary support and its primary resistance of $1.319.

After the formation of a bullish marubozu candlestick over the daily trading chart bulls tried to break out of the consolidation by breaking its primary resistance. Bullish marubozu showed that the bulls have taken control over the market but sellers quickly came in the majority and pushed back. FLOW below its primary resistance making the previous breakout a false breakout.
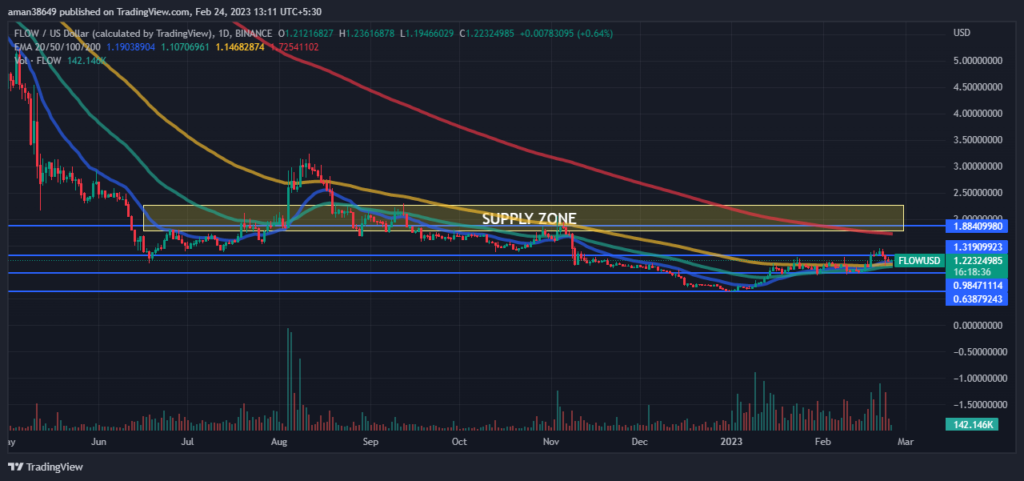
The volume of the coin has decreased by 47.01% in the last 24 hours. The decrease in volume indicates that the number of sellers has increased. This shows that sellers are trying their best and there is a relationship between volume and the price of FLOW, which represents strength in the current downtrend.
The technical analysis of FLOW
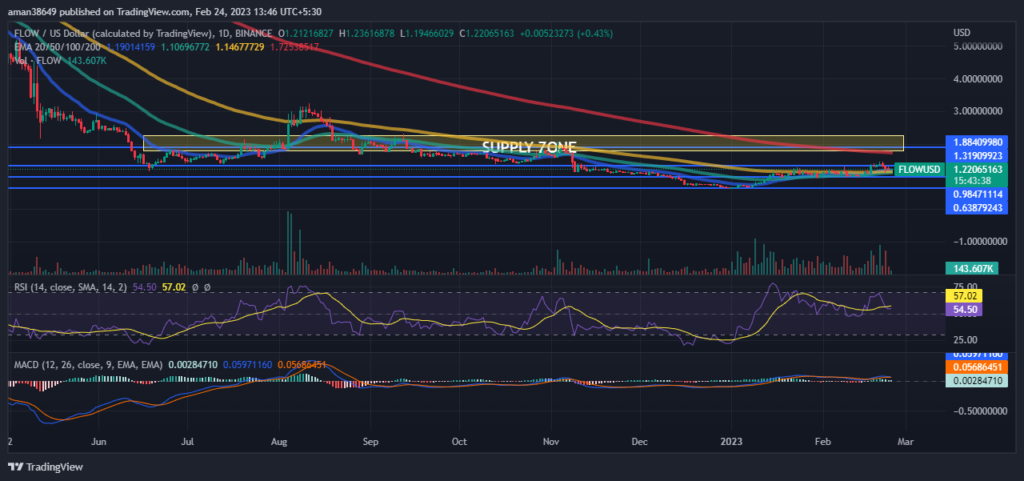
RSI is decreasing in the overbought zone and has shown a negative crossover which indicates that the sellers are coming in the majority and pushing FLOW downwards. This suggests the strength of the current bearish trend. The current value of RSI is 54.50 which is below the average RSI value of 57.02.
The MACD and the signal line are decreasing and intersecting and also showing signs of a negative crossover, which also supports the RSI indicator. Investors need to watch every move over the charts during the day’s trading session.
Conclusion
Flow price analysis suggests that it is currently in a bearish phase. On the last day of 2022, FLOW made its new 52-week low. After the start of 2023, Flow started rising but after breaking its primary support it began consolidation and when buyers tried to break out of consolidation sellers pushed back FLOW below its primary resistance. The decrease in volume indicates the lack of confidence of traders toward FLOW. RSI is decreasing and shows a negative crossover and MACD also gives evidence to RSI which indicates the strength in the current bearish trend, as per technical indicators.
Technical Levels
Resistance level- 1.319 and $1.884
Support level- $0.984 and $0.638
Disclaimer
The views and opinions stated by the author, or any people named in this article, are for informational purposes only, and they do not establish financial, investment, or other advice. Investing in or trading crypto assets comes with a risk of financial loss.

Andrew is a blockchain developer who developed his interest in cryptocurrencies while pursuing his post-graduation major in blockchain development. He is a keen observer of details and shares his passion for writing, along with coding. His backend knowledge about blockchain helps him give a unique perspective to his writing skills, and a reliable craft at explaining the concepts such as blockchain programming, languages and token minting. He also frequently shares technical details and performance indicators of ICOs and IDOs.


