
 Home
Home News
News
- 1 STX price after breaking out of 200 EMA gave a bullish move of more than 80%
- 2 STX might be looking for a correction
The STX price has been on a bull trend since the mid-Februry although now the market has started giving some bearish indications. The overall market levels are currently at a neutral level around point 51 according to the site alternative (dot) me which measures the market sentiments and according to coinglass site which is a cryptocurrency futures trading and information platform the buyers are still dominating the market by 50-51%.
STX price on the bullish rally due a correction
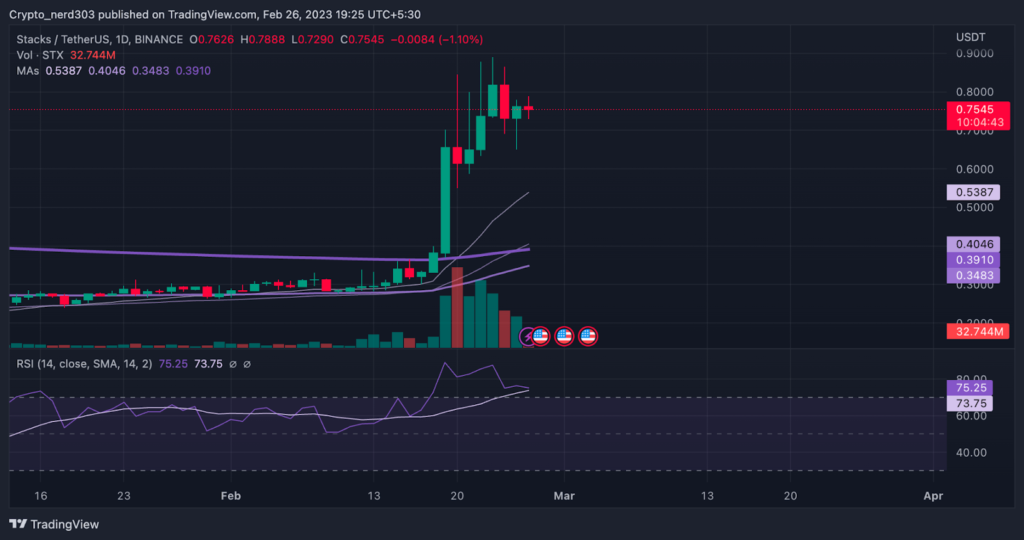
After giving an extremely bullish rally of more than 80% STX price is currently making spinning tops candlestick patterns which is a trend reversal candlestick pattern and is formed when buyers hesitate in supporting the price further and the sellers start overpowering the market which causes the trend to reversal. The current STX price is $0.75 with a change in 24 hour trading volume of 29%
STX Technical Analysis on ( 1 Day Timeframe)
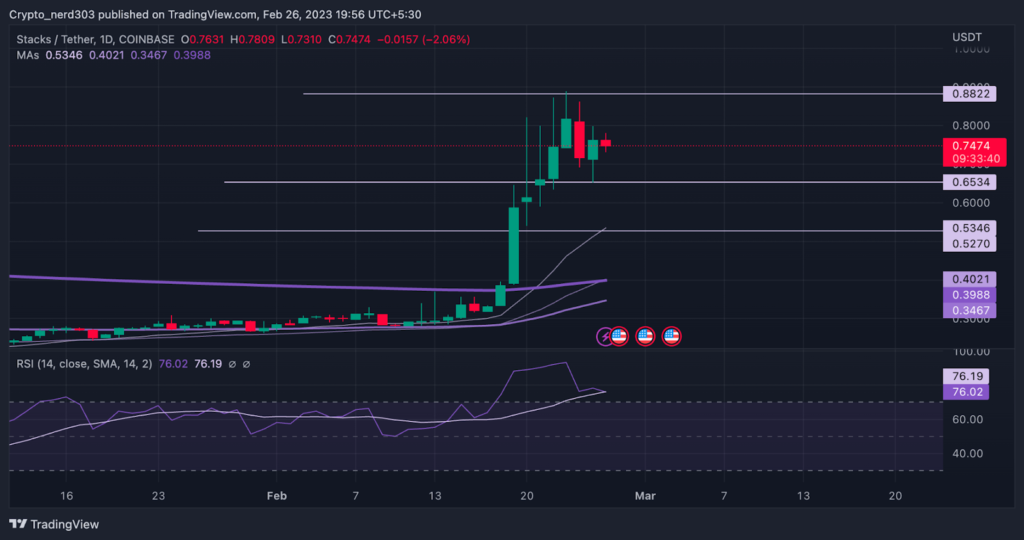
After making a narrow convergence the STX price crossed over the 200 EMA with a strong bullish candle giving a rally of above 80% while 20 EMA have also crossed above it and the other major averages although because the price is trading far away from the EMA’s chances are that Stacks price is soon going to take a correction as it is due because of the long divergence of price from the EMAs
The current support for STX is near the price of $0.65 around 10% below its current price while it’s next while its next major support is 28% below around price of $0.52 and the Stack price’s recent resistance is around the level of $0.88
The RSI line is trading near the overbought levels around point 76.08 which is taking support from the 14 SMA line which is trading just below it around 76.32 points. The downward curve from the overbought level is suggesting that the price is currently trading in the supply zone and it might soon take a correction.
Conclusion
STX price is currently trading near the supply zone and will start moving toward the demand zone in the upcoming days. Currently, there is some indecision while the bulls are still winning by a small percentage although as the price has taken divergence from the EMA’s and the RSI line is trading near the oversold levels it states the market is due to a correction and it might take that correction soon.
Technical levels –
Support – $0.65 and $0.52
Resistance – $0.88
Disclaimer
The views and opinions stated by the author, or any people named in this article, are for informational purposes only, and they do not establish financial, investment, or other advice. Investing in or trading crypto assets comes with a risk of financial loss.

Nancy J. Allen is a crypto enthusiast, with a major in macroeconomics and minor in business statistics. She believes that cryptocurrencies inspire people to be their own banks, and step aside from traditional monetary exchange systems. She is also intrigued by blockchain technology and its functioning. She frequently researches, and posts content on the top altcoins, their theoretical working principles and technical price predictions.


