
 Home
Home News
News

Tezos coin is in bullish territory nowadays, sustaining above $1.000. XTZ is facing resistance near 200 days EMA and striking back toward the support mark of $1.1000. The coin is now holding on to the 50-day EMA and looking for an interim bounce. Moreover, the coin stayed in a bullish trajectory since last week. The coin is trading inside a rising parallel channel, bulls cannot break the upper trendline and lack the momentum resulting in a dropdown in price. XTZ is above the immediate support of $1.100, the crucial range to hold. If it breaks, the coin may retest the $1.000 level, again.

XTZ daily chart shows a persistent bullish trend
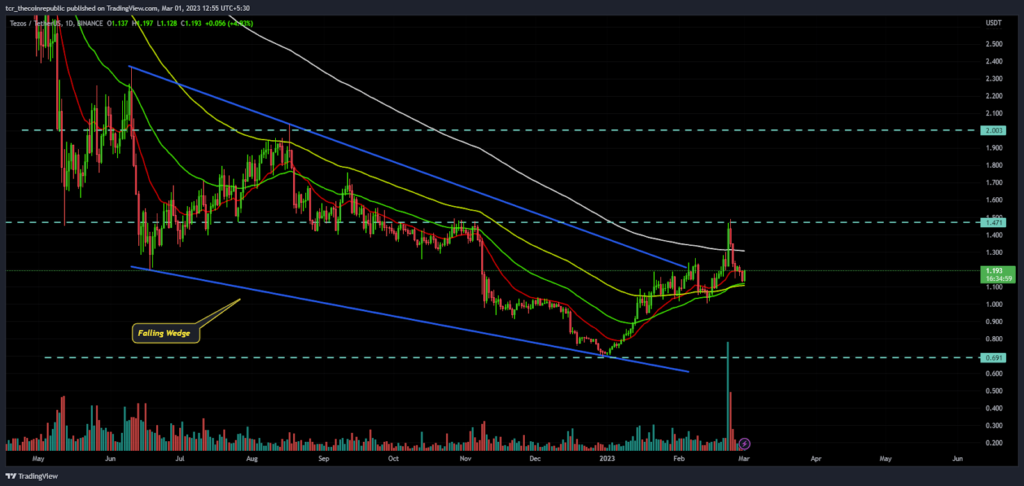
Tezos price was corrected by 22% on the daily chart this week amid the bullish moves. The bears strongly cover the range near 200 days EMA at $1.4000. Moreover, the falling wedge pattern on the chart signals that the coin will target its upside trajectory mark of $2.000 in upcoming sessions.

At the time of writing, XTZ is at $1.19 with an intraday gain of 0.91%. Moreover, the trading volume delivers neutrality in the last 24 hrs.
Tezos price is near the 50 days EMA which is a strong support mark for the bulls to establish a base to launch from in the upcoming sessions.
Last week, the partnership of Tezos blockchain with Google Cloud to develop Web 3 applications favoured the bulls to gain momentum resulting in the formation of a new resistance mark of $1.470. Bears were encouraged further when the coin hit this supply range.
Short term charts shows Price correction
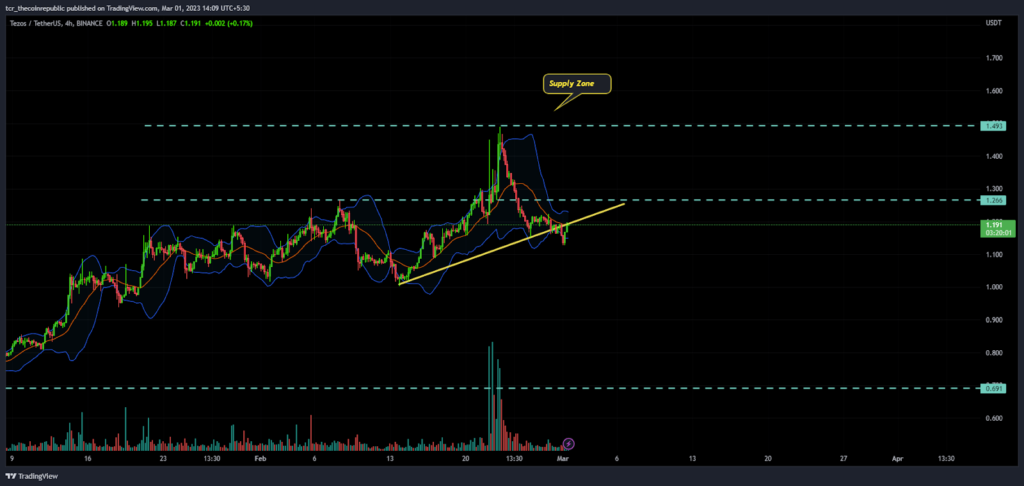
On the 4 hours chart, XTZ breaks the lower trendline and again retests the mark. The sellers are engaging and beating the buyers by making short positions. Last week, the price suddenly broke the range with volume addition. However, selling pressure was strong and continued to break the momentum of buyers. XTZ showcased aggressive selling pressure this week, corrected by 19%.
Traditional indicators on Tezos
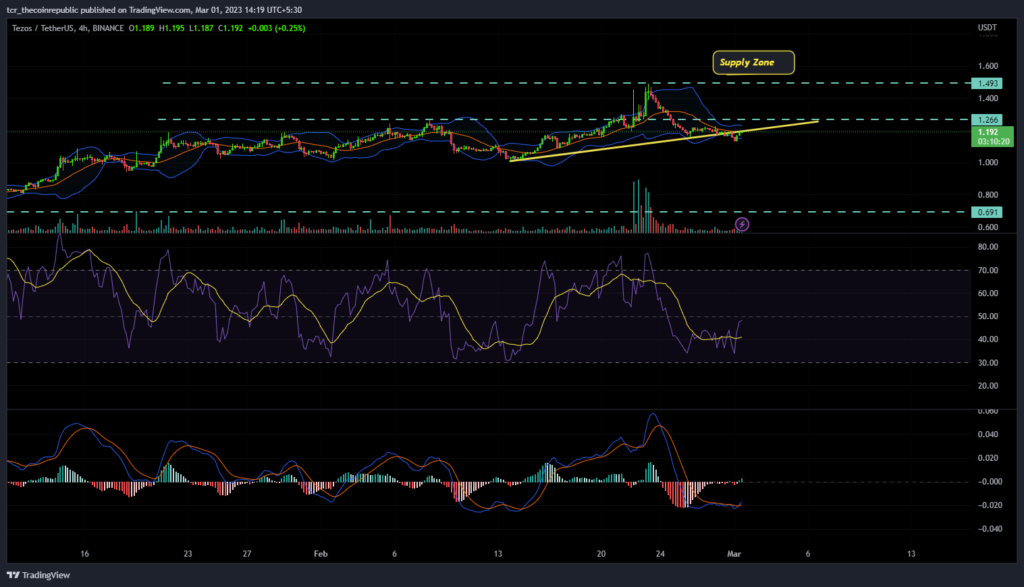
RSI: The RSI curve reciprocates to neutrality at 47 from the sellers region and indicates that buyers are accumulating the price near the support to retest the previous swing of $1.3000 in the upcoming sessions.
MACD: The MACD curve glanced at a bullish crossover and initiated to plot green bars on the histogram. The coin will get above the trendline and continue to show bullish dominance.
Technical Levels
Support Levels: $1.100 and $1.000
Resistance Levels: $1.300 and $1.500
Conclusion
Tezos coin was revamped from the supply range and held near the support mark. The leading indicators also favor bulls that are ready for a further pullback. The coin sustains at the 50 days EMA. Further buying activity may be seen.
Disclaimer
The views and opinions stated by the author, or any people named in this article, are for informational ideas only, and they do not establish financial, investment, or other advice. Investing in or trading crypto assets comes with a risk of financial loss.
Steve Anderson is an Australian crypto enthusiast. He is a specialist in management and trading for over 5 years. Steve has worked as a crypto trader, he loves learning about decentralisation, understanding the true potential of the blockchain.


