
 Home
Home News
News
- DASH coin price has been on a strong uptrend on a daily time frame and recently it stormed past the important supply zone.
- DASH coin price is forming a flag and pole pattern on a daily time frame.
- The pair of DASH/BTC is trading at the price level of 0.003061with a decrease of -1.23% in the past 24 hours.
DASH coin price is on a strong bullish run from the past couple of weeks and recently it broke an important supply zone after which it retested the breakout zone and started moving up again. As of now the DASh coin price soo forming a higher high and higher low price structure formation on daily time frame.
DASH coin price forms a bullish chart pattern
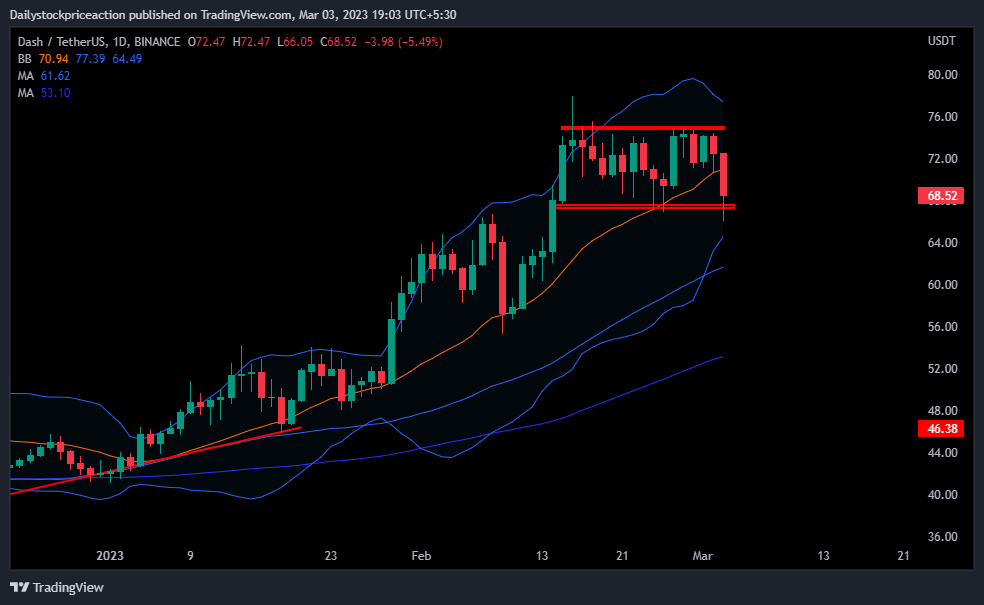
DASH coin price, as per the price action is super bullish and same is seen on daily time frame after the coin price broke the resistance and started moving up. At present, the coin price is trading above the 50 and 100 Moving Averages. This comes after the coin price broke the important MAs. Moving upwards during the pullbacks these MAs can v]be seen acting as a strong demand zone.
DASH coin price is currently hovering around the upper band of the bollinger band indicator after bouncing off the lower band with a strong bullish pressure. The coin price has managed to sustain at the supply zone showing strong consolidation despite a strong fall in the global cryptocurrency market. Thus, indicating a possible strong movement in the coming days. Volumes have increased as the coin price showed a strong bullish move.
DASH coin price is forming a flag and pole pattern
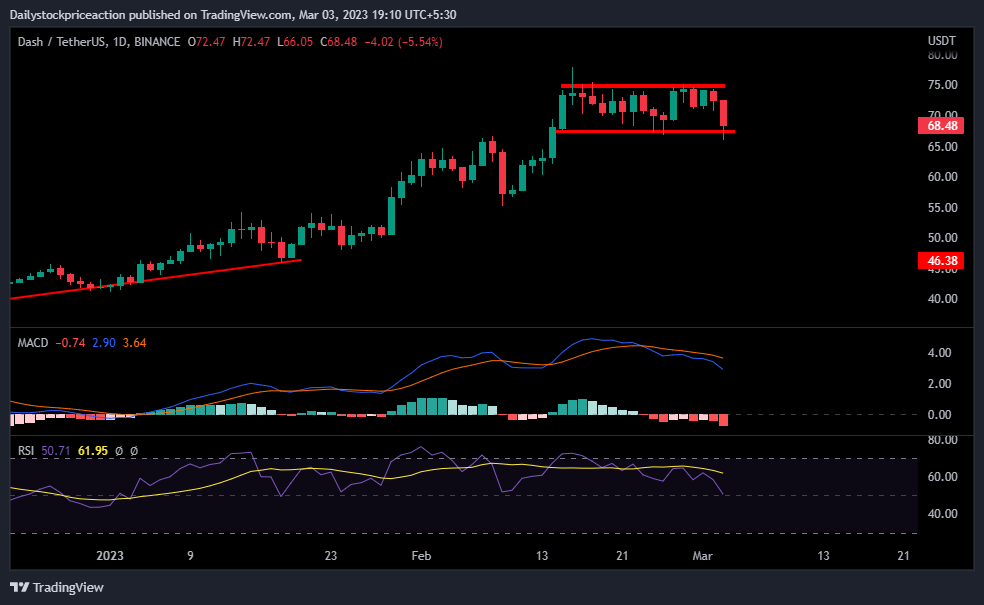
The DASH coin price is trading at the demand zone after falling from the supply zone. The recent fall in the price of the DASH coin price triggered a negative crossover on the MACD indicator. The blue line crossed the orange line on the downside. If the coin price can sustain at the demand zone and bounces off it breaking the falling wedge pattern, the MACD lines can be seen triggering a positive cross-over. Investors should wait and watch for a proper signal of the trend as a breakdown of the current long-term demand zone will trigger the MACD line widening supporting the trend.
RSI curve is trading at the level of 49.33. The RSI curve is yet to cross the halfway mark of 50. Once the coin crosses the supply zone of 75 the coin price can be seen moving up with strong bullish momentum. The RSI curve has crossed the 14 EMA yellow line indicating a short-term bullishness. Once the RSI crosses the halfway mark of 50 the DASH coin price can be seen breaking the supply zone, supporting the trend.
Conclusion: DASH coin price is showing a good bullish strength despite a strong fall in the overall cryptocurrency market. The technical parameters are neutral but the price action suggests a strong bullish run in the upcoming days. Therefore investors should remain calm and wait for a proper breakout on either side and then act upon it.
Support: $66 and $63
Resistance: $75 and $79
Disclaimer
The views and opinions stated by the author, or any people named in this article, are for informational purposes only, and they do not establish financial, investment, or other advice. Investing in or trading crypto assets comes with a risk of financial loss
Steve Anderson is an Australian crypto enthusiast. He is a specialist in management and trading for over 5 years. Steve has worked as a crypto trader, he loves learning about decentralisation, understanding the true potential of the blockchain.


