
 Home
Home News
News
- The price of XLM coin had been increasing in the last few trading days, but it recently encountered a significant resistance level on the daily chart and was unable to break through.
- There is now a double top formation on the daily chart for XLM coin price.
- Currently, the XLM/BTC pair is trading at a price of 0.00000378, which represents a 0.90% decline over the past four hours.
According to price action, the daily time frame of the XLM coin price is bearish, while the weekly time frame of the coin price is consolidating inside a narrow range after exhibiting a strong bullish trend. The XLM currency is now trading at a price level of 1.568. The coin price is still optimistic on a shorter time scale.
XLM coin price is bearish on a daily time frame
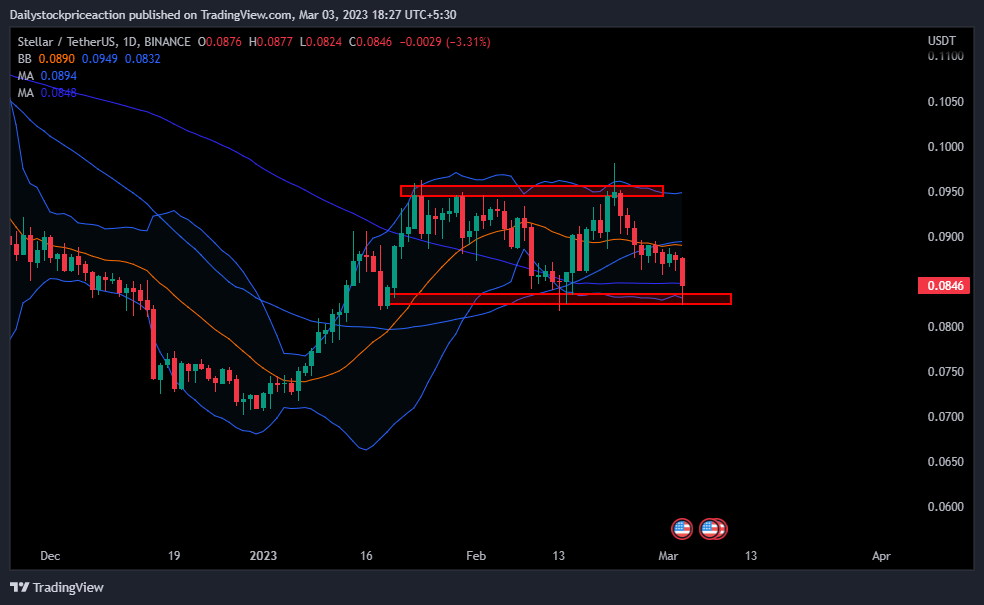
According to price action, the XLM coin price is poised for a significant rise after experiencing strong rejection from the crucial supply zone on a daily time frame. The coin price was trading in the supply zone prior to the current movement, but following a significant bearish move over the previous week, it has now plummeted below the significant 50 and 100 Moving Averages, which when moving upward can be seen functioning as a strong demand zone.
After a negative pressure from the upper band, the price of the XLM coin is currently trading at the centre of the bollinger band indicator. It has also surpassed the 15 EMA, showing a strong bullish pressure if it successfully retests the EMA. Since the coin price dropped to the area of long-term demand, volumes have consolidated. The coin price will either burst through the demand zone or take support and bounce off of it.
XLM coin price is forming a double top pattern on a daily time scale
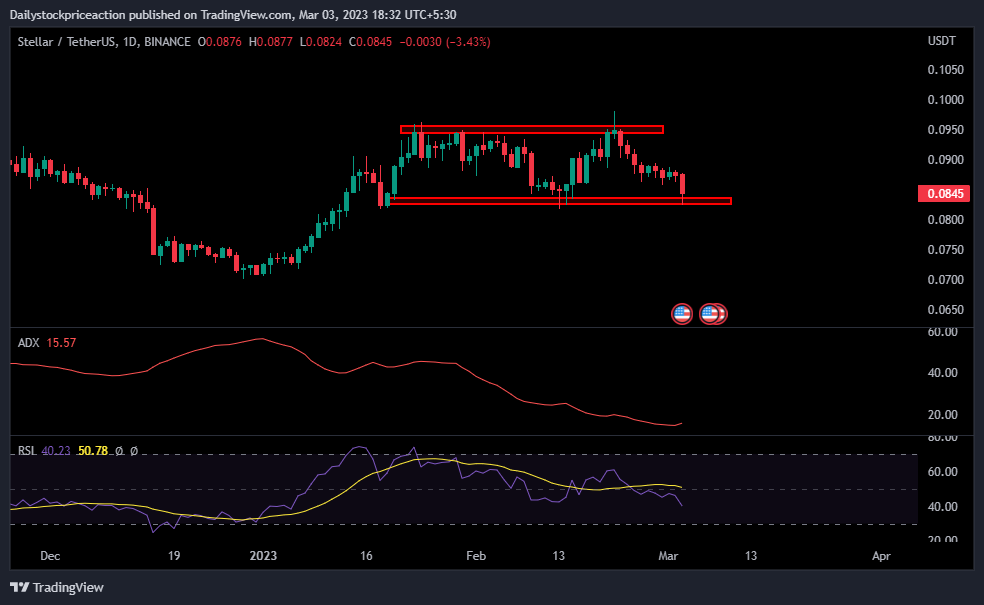
The trend of the movement of the coin price is observed in the average directional movement index. It turned negative and began to tumble as a result of the intense bearish pressure. The XLM coin price is currently dropping below the 20 level, signalling significant bearish pressure. Despite the fact that the ADX curve has shifted sideways, this suggests that price action may slow down and the price structure may alter in the future trading days.
In spite of intense negative pressure over the previous several trading days, the relative strength index curve is demonstrating a solid resistance to the bears. The RSI curve is now trading at a price level of 40587. The coin price will likely bounce off the demand zone once it passes the midway point of 50 with a strong positive pressure.
Conclusion: The price of the XLM coin is able to remain above the demand zone when viewed on a daily time frame, but the technical indicators are uncertain because they display a neutral trend. It is still unclear if the coin price will break through the demand zone or withstand the bearish pressure and bulls take the lead as the coin price builds a bearish price structure.
Support: $0.083 and $0.078
Resistance: $0.0947 and $0.0980
Disclaimer
The views and opinions stated by the author, or any people named in this article, are for informational purposes only, and they do not establish financial, investment, or other advice. Investing in or trading crypto assets comes with a risk of financial loss

With a background in journalism, Ritika Sharma has worked with many reputed media firms focusing on general news such as politics and crime. She joined The Coin Republic as a reporter for crypto, and found a great passion for cryptocurrency, Web3, NFTs and other digital assets. She spends a lot of time researching and delving deeper into these concepts around the clock, and is a strong advocate for women in STEM.


