
 Home
Home News
News
- 1 TRON price is trending within a parallel channel after breaking its resistance
- 2 TRON is partnering with Orachain which can have a positive impact on the price.
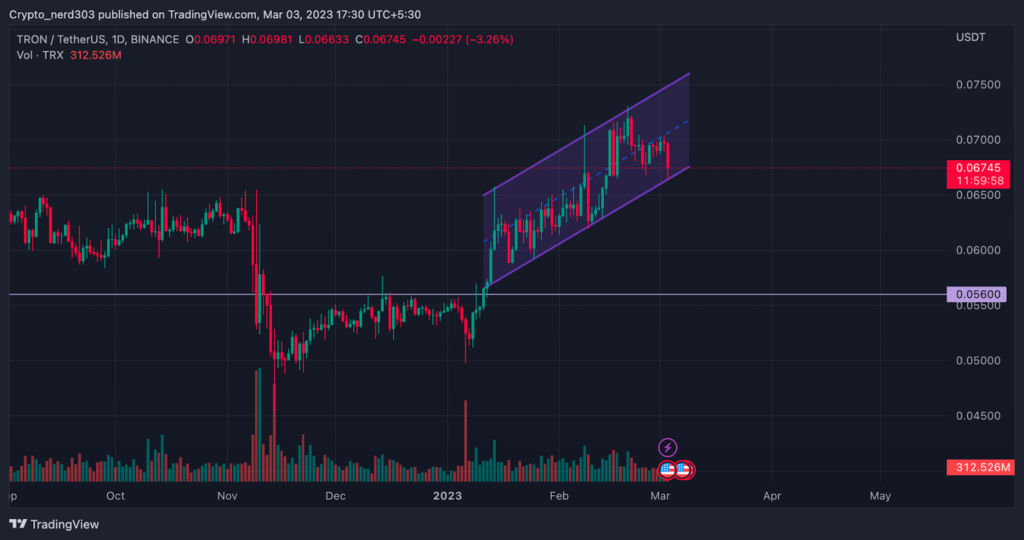
TRX’s price after taking resistance from the price level of $0.056 made a breakout and gave a rally of 30%. Currently, TRX is consolidating within an ascending parallel channel giving a move of 8 – 15% on each rally and correction. The TRX price is at present taking support from the base level of its consolidation trading near the demand zone. Although the red candle is yet to give a close if this red candle gives a close above the support zone of the consolidation with a bullish candlestick pattern like a bullish engulfing candle and a hammer or doji it would confirm the changing of trend.
TRON price making a consolidation channel ( Daily Timeframe )
TRON (TRX) is a blockchain-based operating system that was developed by the Tron Foundation in 2017. TRON was built to create a decentralised Internet platform and serve as a tool for developers so that they can create Dapps while acting as an alternative to Ethereum. With the help of Tron, anyone can create a Decentralized application and offer content and in return, they can receive a TRON token as compensation.
The overall market sentiments are currently trading at the neutral level of around 50 points according to the greed and fear Index provided by the Alternative(dot)me. While the TRX price is being overpowered by the sellers across most of the major cryptocurrency exchanges.
Technical Analysis ( 1 Day Timeframe )
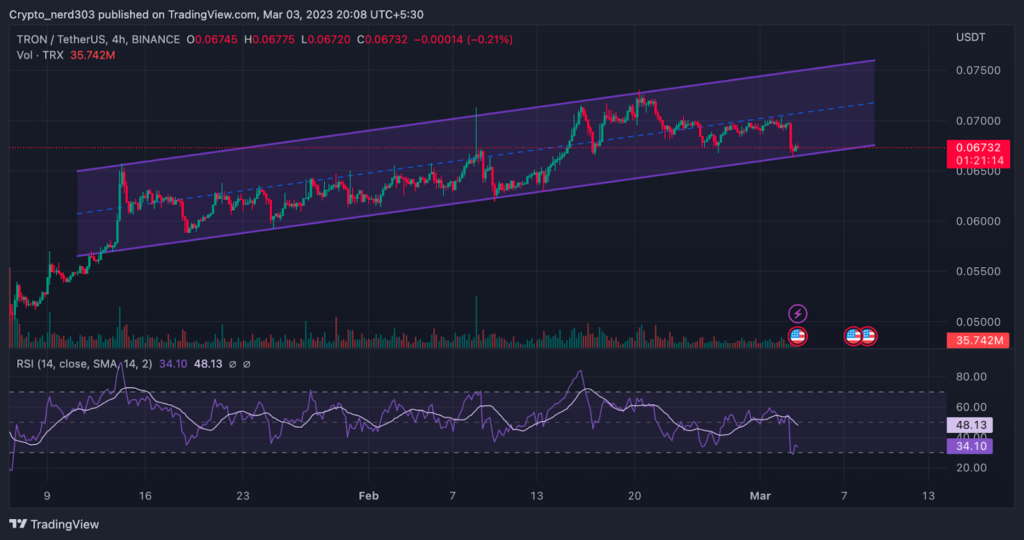
TRX price is moving within a parallel channel of ascending consolidation pattern. After giving a bullish rally the TRX price started consolidating from early January to early march moving between the price range upper layer 0.076/0.067 to lower layer 0.064/0.056. While the price is taking the resistance median line and the upper line.
The RSI line is trading near 34.17 points near the supply zone while it is taking a reversal from the oversold level and the 14 SMA line is trading near the 48.26 point. The making of the upward curve of the RSI line is suggesting that the RSI line might soon start moving on an uptrend toward the supply zone.
Conclusion
The TRX price is currently taking support from the level of $0.066 while its current resistance level is around the price of $0.072 and its next major resistance is around the price of $0.076. If TRX’s price makes a positive bullish candle it might give a positive rally of 12 percent.
Technical levels
Support – $0.066
Resistance – $0.072 and $0.076
Disclaimer
The views and opinions stated by the author, or any people named in this article, are for informational purposes only, and they do not establish financial, investment, or other advice. Investing in or trading crypto assets comes with a risk of financial loss.

Nancy J. Allen is a crypto enthusiast, with a major in macroeconomics and minor in business statistics. She believes that cryptocurrencies inspire people to be their own banks, and step aside from traditional monetary exchange systems. She is also intrigued by blockchain technology and its functioning. She frequently researches, and posts content on the top altcoins, their theoretical working principles and technical price predictions.


