
 Home
Home News
News
Dutch Bros Inc. stock remained in a narrow congestion zone and is willing to escape the range. From the start of 2022, Bros share price accumulated from the demand zone near $26, meeting the major trendline near $40. Last week, BROS reported (Q4 2022) earnings which were disappointing. The net income was fell by 62%, while revenue stayed neutral with a small increase of 2.77%. Bulls have a weak grip on the lower trendline. Dutch BROS share traded below the significant moving averages and is in bearish territory in the last few sessions.
BROS stock price hovered around $34.35 during yesterday’s market sessions with a rebound of (+4.34%). The price action shows that bulls are attempting to fill the remaining gap upside.
The double bottom structure was formed on the chart, indicating that if the bulls endure in holding and breaking above the neckline of $40, fresh buying activity will rally prices. On the other hand, further selling may be seen if it cannot sustain near $33.
Daily charts show bulls healing the muscles
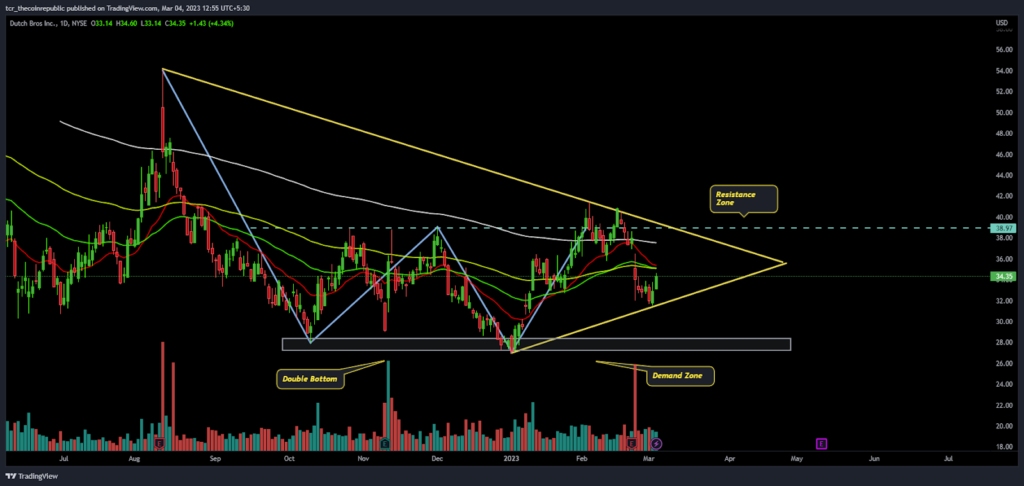
Dutch Bros or Bros stock shows that the bulls are fighting hard to hold on while the bears aggressively force to break the momentum of buyers. The stock tried to surpass $40 but refused multiple times, indicating strong resistance. The price action clues that the range between $32 – $38 was a strong congestion range. At $35, multiple EMAs react as an immediate resistance that bulls like to face. If bulls hold the selling pressure, buyers will again be ready to register for a short-term bounce in the upcoming session.
Moreover, BROS share price was near the paws of the lower Bollinger band, and the trajectory was not favoring the bulls. The price slipped by over 20% in the last 10 trading sessions.
Short-term charts show a pullback
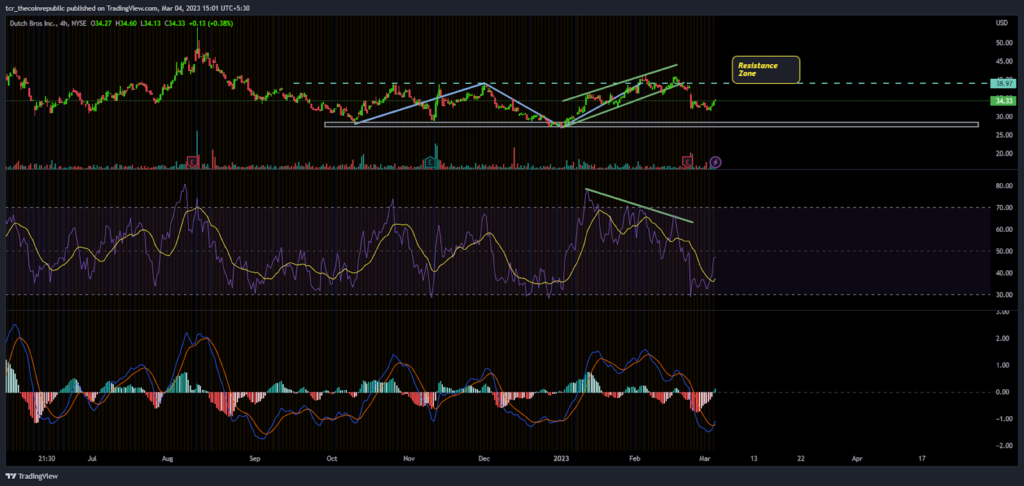
Dutch Bros stock on a 4-hour chart indicates a reversal in the last trading session. The stock price is now at a make or break level where either side’s moves will be expected. Moreover, the volume on the chart also increased this week.
The RSI (Relative Strength Index) pulls back from the oversold region and heads towards the neutral range. Moreover, RSI showed negative divergence last week, which weakened the bulls’ momentum, resulting in a breakdown of the rising parallel channel.
Moreover, the MACD curve ended the bearish moves and started to plot a green bar on the histogram last session. The bullish crossover is on the verge of registering a fresh move. The curve stayed in negative region, expecting a bounce for now.
Support Levels: $30 and $26
Resistance Levels: $40 and $45
Conclusion
Dutch BROS stock is is trying to retain the $40 level. Above that, the bullish territory exists. Multiple analysts have downgraded price ratings, exacerbating selling pressure.
Disclaimer
The views and opinions stated by the author, or any people named in this article, are for informational purposes only, and they do not establish financial, investment, or other advice. Investing in or trading crypto assets comes with a risk of financial loss.

Andrew is a blockchain developer who developed his interest in cryptocurrencies while pursuing his post-graduation major in blockchain development. He is a keen observer of details and shares his passion for writing, along with coding. His backend knowledge about blockchain helps him give a unique perspective to his writing skills, and a reliable craft at explaining the concepts such as blockchain programming, languages and token minting. He also frequently shares technical details and performance indicators of ICOs and IDOs.


