
 Home
Home News
News

- The ZIL coin price is in a significant increase after breaking through the daily time frame’s small-term supply zone.
- On a daily time period, the ZIL coin price is developing a rounded bottom pattern.
- The price of the ZIL/BTC pair has increased by 1.78% over the last 24 hours to 0.00000124.
The price of the ZIL coin has broken out of the supply zone and is currently on a strong upswing. It has recently started to consolidate close to the long-term supply zone. The price of the ZIL coin has since dropped after climbing to the supply zone after initially displaying a positive advance off the demand zone. As a result, a bullish rounding bottom pattern has developed in the price of coins.
ZIL coin price forms positive price structure
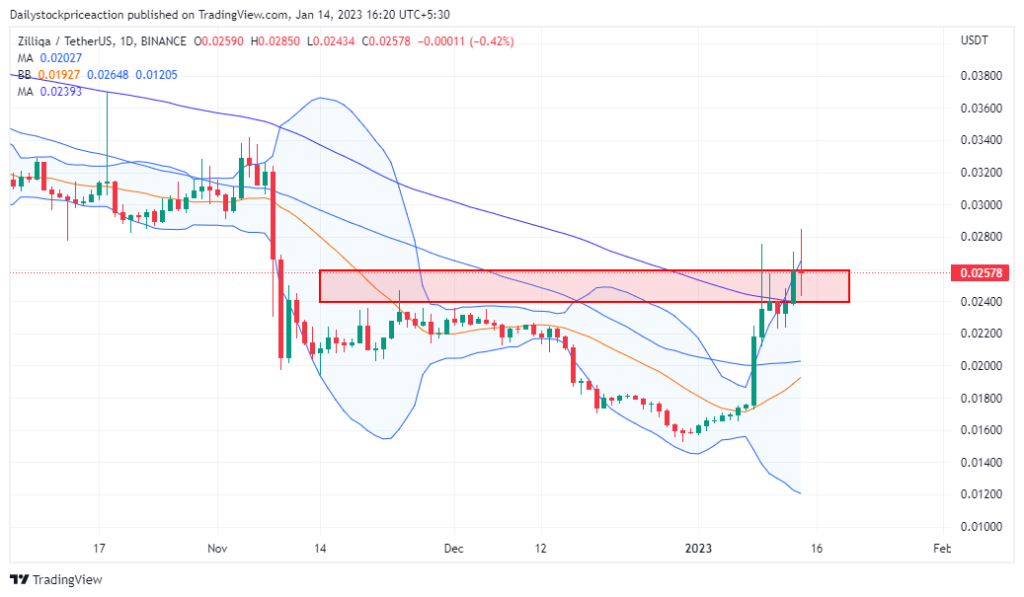
The ZIL coin price has started forming higher high and higher low formations on a daily time frame. At present, the ZIL coin price is trading in the middle of the Bollinger band indicator after failing to surpass the upper band. The ZIL coin price has gone past the 20 EMA and therefore the ZIL coin price can take support moving upwards.

The ZIL coin price has also crossed the 50 and 25 Moving Average. This comes after the coin price broke an important supply zone on a smaller time frame. Going forward these MAs can act as a strong demand zone. Volumes have increased as the coin price bounced off the demand zone strongly. Investors should wait for a breakout of the supply zone and then act accordingly.
The ZIL coin price is forming a rounding bottom pattern on a daily time scale

When the coin price rises, the ADX curve has been climbing on a greater time period. It is encouraging for the price of coins. The ADX curve has fallen out of the 20 level and turned higher on a daily time frame. As of a 4-hour time period, the coin price is stable at the short-term demand zone. Investors want to hold off until a bullish candle pattern forms in the demand zone.
The RSI curve is now at a price of 39.57. The RSI curve has not yet surpassed the 50-percent threshold. On a daily time scale, the price of the ZIL coin has shown a breakout of a strong short-term supply zone. The RSI curve will begin to rise quickly as the coin price breaches the rounded bottoms pattern. The yellow 14 EMA line has been crossed by the RSI curve, signalling a short-term bullishness. The RSI curve will cross the 50-percent level at the breakout of the bullish chart pattern, supporting the breakout.
The coin price has been circling the supply zone while the MACD signal has been bullish. The blue line’s upward crossover of the orange line produced a positive crossover on the MACD indicator. The MACD lines may broaden, sustaining the trend, after the ZIL coin price exceeds the supply zone’s rounded bottom in the chart pattern.
Conclusion: The ZIL coin price is super bullish for the last couple of days and the same is seen on the chart. The price action and the technical parameters suggest the same. It remains to see if the coin price will break the supply zone or face rejection and falls.
Support: $0.025 and $0.021
Resistance: $0.029 and $0.036
Disclaimer
The views and opinions stated by the author, or any people named in this article, are for informational ideas only, and they do not establish financial, investment, or other advice. Investing in or trading crypto assets comes with a risk of financial loss.

Nancy J. Allen is a crypto enthusiast, with a major in macroeconomics and minor in business statistics. She believes that cryptocurrencies inspire people to be their own banks, and step aside from traditional monetary exchange systems. She is also intrigued by blockchain technology and its functioning. She frequently researches, and posts content on the top altcoins, their theoretical working principles and technical price predictions.


