
 Home
Home News
News
- HBAR price is trending in a bear trend after crossing the 200 EMA.
- HBAR price took a downturn of 25 percent after the bull rally
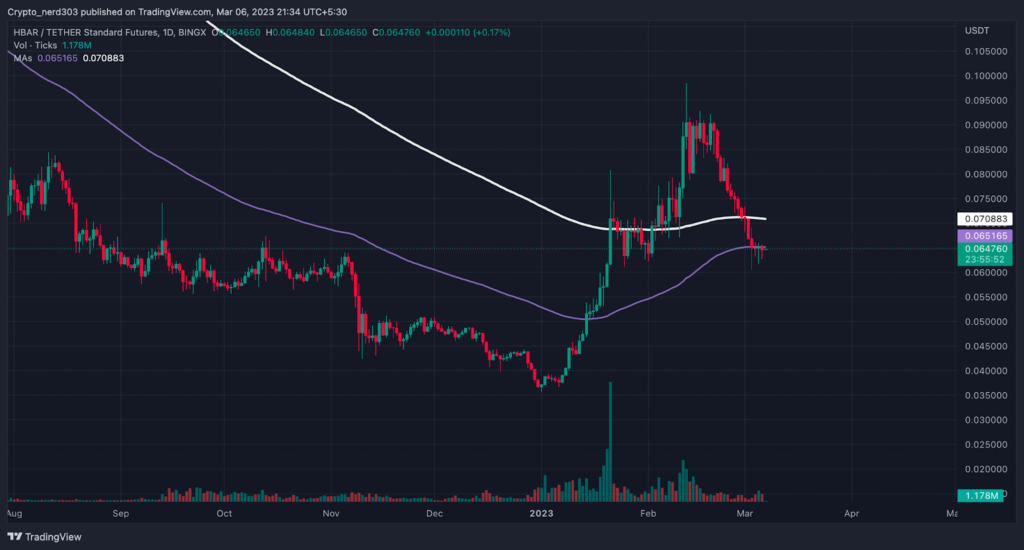
HBAR after crossing over the major key averages after a short consolidation and a bullish candlestick pattern of three white soldiers made an extremely bullish rally by giving a 51% uptrend and after taking resistance from the 200 EMA HBAR price made an engulfing candle the price broke the resistance level and made its recent high after coming out of the bear trend at the level $0.090 although the price couldn’t sustain above those levels and took a downturn of 30% crossing below the 200 EMA after making a dark cloud cover pattern. The current price of HBAR is $0.064 with a change in 24-hour trading volume of 1.75 percent.
The HBAR price taking support from the 100 EMA (Daily Timeframe)
According to the site, Alternative (dot) me which measures market sentiments the overall market conditions are treading at a neutral level of around 47 points seeing a decline of 3 points within the last week. The HBAR price is currently being dominated by sellers across most of the major cryptocurrency exchange platforms although the Buyers are supporting the price aggressively across some of the platforms by 64%.
Technical Analysis ( On 1 Day Timeframe)
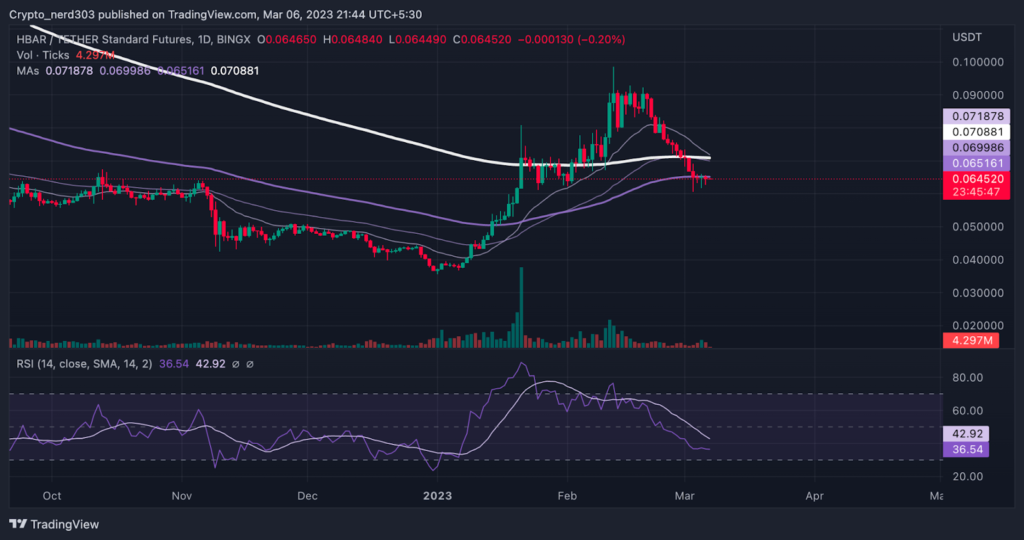
The HBR price after crossing below the 200 EMA with a strong momentum is currently taking support from the 100 EMA and 50 EMA around the price of $0.064 while the 20 EMA is trading just above the 200 EMA which is trading at $0.070 and the price is taking resistance from it.
The RSI line is trading in a downtrend near the demand zone around 36.54 points while taking resistance from the 14 SMA which is trading at around 42.92 points. The RSI line is currently trading near the demand zone near the 30 points the RSI curve at the demand zone is suggesting that the price might start moving toward the supply zone.
Conclusion
The HABR price is currently trading below the 200 EMA while making spinning top patterns indicating that the supply is ending and the buyers might start taking over the price action. While the price is also making a doji candle which is a bullish signal which is often found before the beginning of a bull or a bear trend. While the price might also take support from an important support level around the recent levels.
Technical levels –
Support – $0.064
Resistance – $0.070
Disclaimer
The views and opinions stated by the author, or any people named in this article, are for informational purposes only, and they do not establish financial, investment, or other advice. Investing in or trading crypto assets comes with a risk of financial loss.

Nancy J. Allen is a crypto enthusiast, with a major in macroeconomics and minor in business statistics. She believes that cryptocurrencies inspire people to be their own banks, and step aside from traditional monetary exchange systems. She is also intrigued by blockchain technology and its functioning. She frequently researches, and posts content on the top altcoins, their theoretical working principles and technical price predictions.


