
 Home
Home News
News
- Aave was currently at $76.09, which increased by 0.51% during the intraday trading session.
- The 24-hour low of AAVE was $75.22 and the 24-hour high of AAVE was $77.65.
- The current Aave token price is below 50 and 100-Day EMA.
The pair of AAVE/BTC was trading at 0.003398 BTC with a rise of 0.53% over the intraday trading session.

Aave price analysis suggests that it is currently in a downtrend. Since the start of 2022, the token was declining which indicates that the sellers were dominating the token from the start of the year. After the token crossed its secondary resistance bulls started participating actively in the market pushing the token upwards. Soon after the token reached its 200-Days EMA sellers took back the market from buyers pushing the token below its primary resistance. Since after the token is consolidating between its secondary support and resistance. Because of the seller’s pressure, the token made its 52-week low on the last day of 2022.

After the start of 2023, the token again started moving upwards breaking its primary support and reaching its primary resistance. Soon after reaching its primary resistance of $93.7, the token began consolidating.
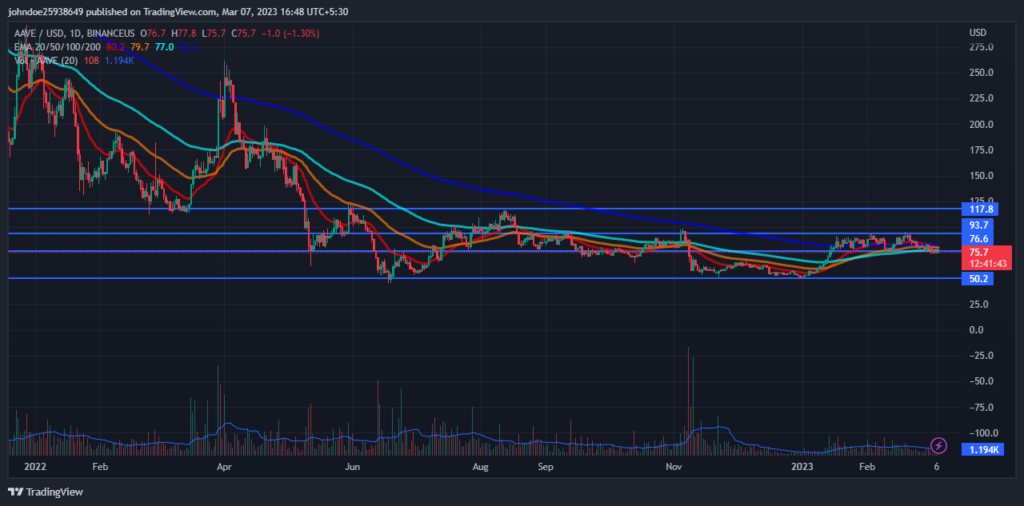
The volume of the coin has increased by 9.83% in the last 24 hours. The increase in volume indicates that the number of buyers has increased. This shows that buyers are trying their best and there is a relationship between volume and the price of AAVE, which represents a weakness in the current bearish phase and a possible reversal.
Aave Price Technical analysis:
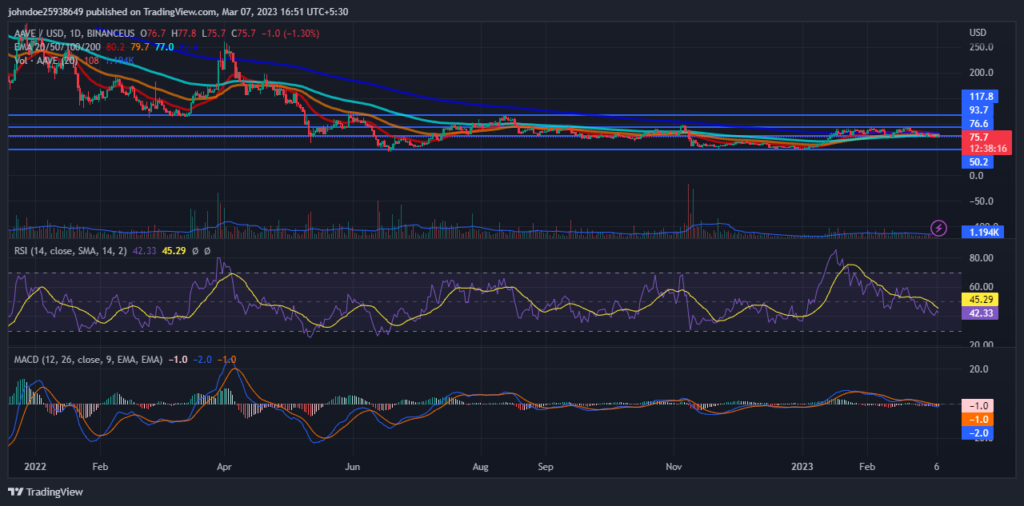
RSI is decreasing in the oversold zone and is showing a negative crossover which indicates that the sellers are coming in the majority and pushing AAVE downwards. This suggests the strength of the current bearish trend. The current value of RSI is 42.45 which is below the average RSI value of 45.30.
The MACD and the signal line are decreasing but not showing a definitive crossover over the daily chart which can support the RSI claims. Investors need to watch every move over the charts during the day’s trading session.
Conclusion
Aave price analysis suggests that the token is currently in a downtrend. 2022 can be said not so a good year for the token because of the seller’s domination throughout the year which can be seen over the daily trading chart. After the start of 2023, the token started rising but after reaching its primary resistance the token began consolidating. The increase in volume shows positive market sentiment towards the token. RSI and MACD both are decreasing which shows strength in the current bearish trend, as per the technical indicators. Traders should make a trade with caution in the market
Technical Levels-
Resistance level- $93.7 and $117.8
Support level- $76.6 and $50.2
Disclaimer-
The views and opinions stated by the author, or any people named in this article, are for informational purposes only, and they do not establish financial, investment, or other advice. Investing in or trading crypto assets comes with a risk of financial loss

With a background in journalism, Ritika Sharma has worked with many reputed media firms focusing on general news such as politics and crime. She joined The Coin Republic as a reporter for crypto, and found a great passion for cryptocurrency, Web3, NFTs and other digital assets. She spends a lot of time researching and delving deeper into these concepts around the clock, and is a strong advocate for women in STEM.


