
 Home
Home News
News

- Ravencoin was currently at $0.02583, which increased by 2.18% during the intraday trading session.
- The 24-hour low of RVN was $75.22 and the 24-hour high of RVN was $77.65.
- The current Ravencoin token price is below 20, 50, 100, and 200-Day EMA.
The pair of RVN/BTC was trading at 0.000001154 BTC with a dip of 1.97% over the intraday trading session.

Ravencoin price prediction suggests that it is currently in a downtrend. Since the start of 2022, the token was in a steep declining phase which indicates that the sellers were hyperactive from the start of the year 2022. After sellers pushed the token below its primary support buyers became active in the market and started pushing the token upwards helping the token enter its supply zone or distribution phase. But soon after sellers again became actively participating in the market which caused a decline in the value of the token. Near the end of the year because of the seller’s pressure, the token was trading below its primary support and near its new 52-week low.

After the start of 2023, the token again started moving upwards breaking its primary support and resistance along its path. But soon after sellers came back into the market pushing the token below its primary resistance of $0.0348 which made the previous breakout a false breakout.
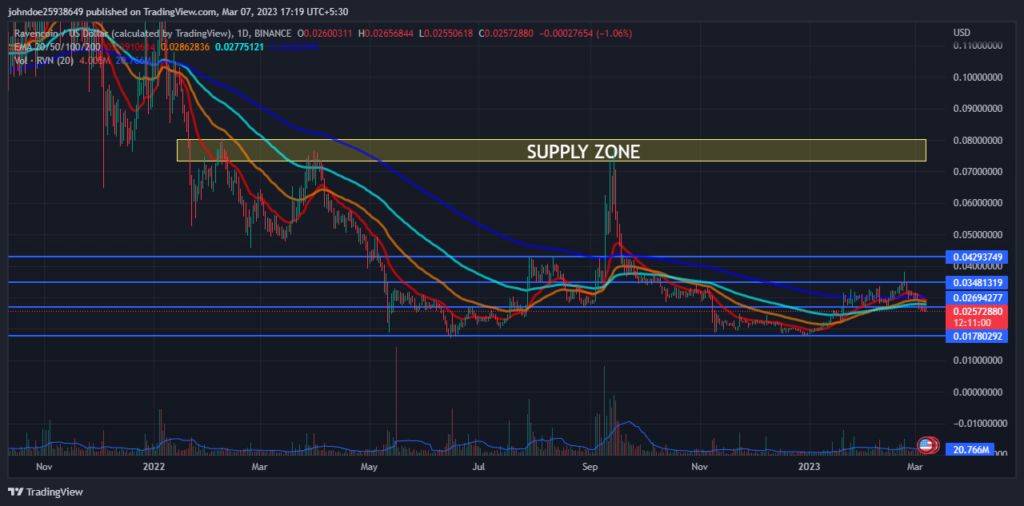
The volume of the coin has increased by 14.43% in the last 24 hours. The increase in volume indicates that the number of buyers has increased. This shows that buyers are trying their best and there is no relationship between volume and the price of RVN, which represents a weakness in the current bearish phase and a possible reversal.
Ravencoin Price Technical analysis:
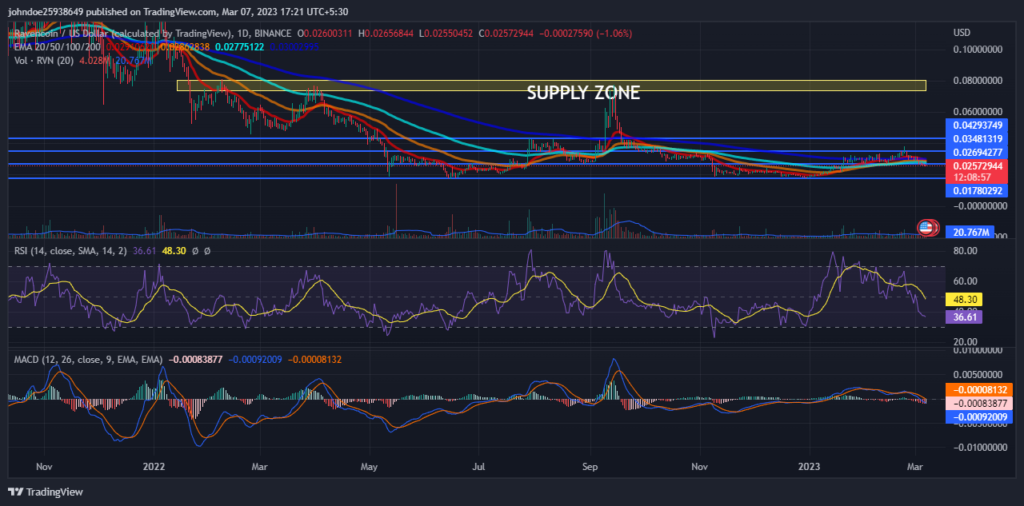
RSI is decreasing in the oversold zone and is showing a negative crossover which indicates that the sellers are coming in the majority and pushing RVN downwards. This suggests the strength of the current bearish trend. The current value of RSI is 36.62 which is below the average RSI value of 48.30.
The MACD and the signal line are decreasing but not showing a definitive crossover over the daily chart which can support the RSI claims. Investors need to watch every move over the charts during the day’s trading session.
Conclusion
Ravencoin price analysis suggests that the token is currently in a downtrend. 2022 was not so good year for the token as the token was in a constant decline throughout the year. This indicates that the sellers dominated the market as seen in the daily trading chart. After the start of 2023 the token started rising but as soon as the token broke its primary resistance sellers took back the market from sellers and pushed the token downwards. RSI and MACD both are decreasing showing strength in the current bearish pattern, as per the technical indicators. Traders should make a trade with caution in the market
Technical Levels-
Resistance level- $0.034 and $0.0429
Support level- $0.026 and $0.017
Disclaimer-
The views and opinions stated by the author, or any people named in this article, are for informational purposes only, and they do not establish financial, investment, or other advice. Investing in or trading crypto assets comes with a risk of financial loss
Steve Anderson is an Australian crypto enthusiast. He is a specialist in management and trading for over 5 years. Steve has worked as a crypto trader, he loves learning about decentralisation, understanding the true potential of the blockchain.


