
 Home
Home News
News
- 1 SHIB token price has managed to sustain at the short term demand zone despite facing strong pressure from the supply zone.
- 2 SHIB token price is forming a falling wedge pattern on a daily time frame.
- 3 At present, the SHIB token price is forming a higher high and higher low price structure on a daily time frame.
SHIB coin price as per the price action is on a strong uptrend trajectory after consolidating for the longest time at a strong demand zone. As of now it is forming a positive price structure indicating a possible up move in the upcoming trading days. At present, the SHIB token price is transacting at the price level of $0.00001098.
SHIB token price raises the hopes of investors
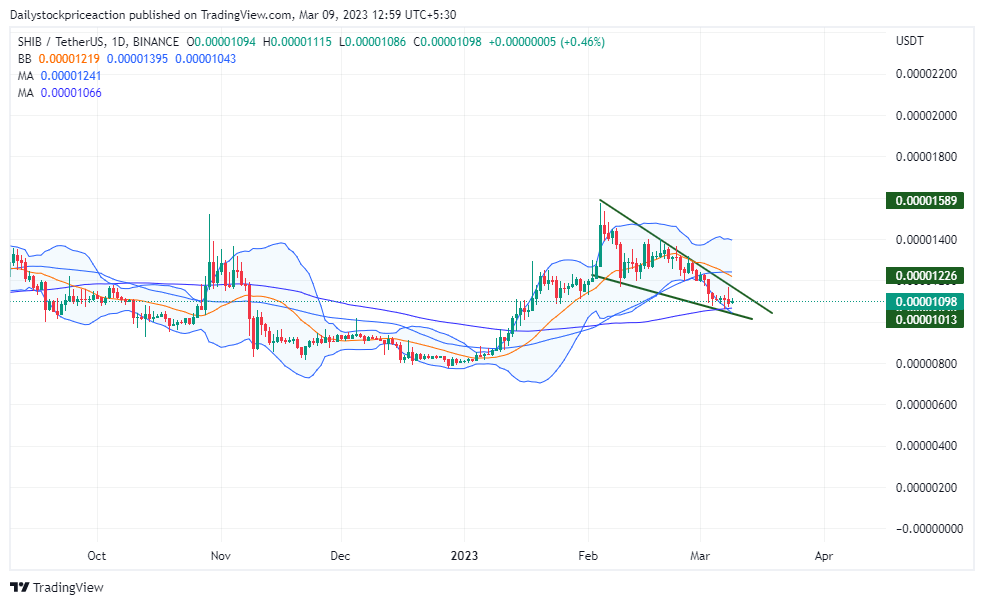
SHIB token price as per the price action is in a strong uptrend. The same is depicted on a different time frame. As of now, the SHIB token price has fallen below the 50 and 100 Moving Averages. This comes after the token price failed to surpass the supply zone on a daily time frame. Moving upwards these MAs can be seen acting as a strong supply zone.
AS of now, the SHIB token price is trading at the lower band of the bollinger band indicator after failing to surpass the upper band. Although the token price is transacting above the 15 EMA it remains to see if the token price will sustain above it or tarnish the support and fall .Volumes have been normal as the token price consolidated.
SHIB token price is forming a falling wedge pattern on a daily time frame
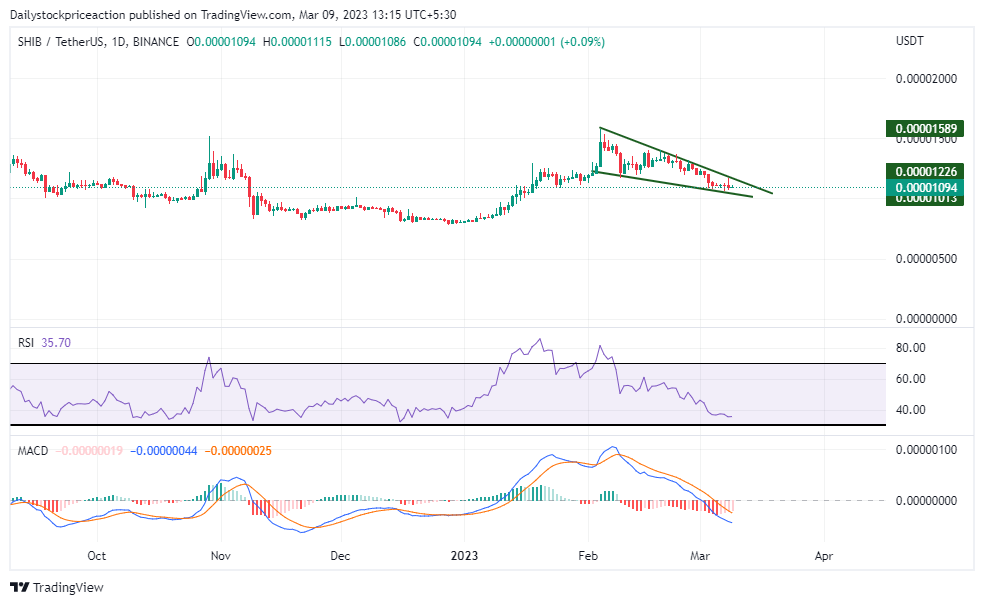
SHIB token price, as per the RSI curve is depicting a small term downtrend. The RSI curve has fallen below the halfway mark of 50 after falling a string bearish pressure the resistance.
At present, the RSI curve is transacting at the price level of 35.70. Once the token price breaks the supply zone with a strong bullish pressure, the RSI curve can also be seen crossing the halfway mark of indicating a strong bullish trend and supporting the breakout.
MACD indicator triggered a negative crossover as soon as the token price fell from the resistance. The blue line crossed the orange line on the downside indicating a bearish trend to prevail for a short term. If the token price manages to hold at the current level and start moving up then the MACD can be seen triggering a positive crossover supporting the price movement then.
Conclusion: SHIB coin price, as the price action suggests, is consolidating currently on a smaller time frame while on a larger time frame it depicts an uptrend. As for the technical parameters, the token might be experiencing a small downtrend before further big moves. Investors should remain cautious and wait for a proper signal or breakout on either side.
Support: $0.00001062 and $0.00001010
Resistance: $0.00001195 and $0.00001250
Disclaimer
The views and opinions stated by the author, or any people named in this article, are for informational ideas only, and they do not establish financial, investment, or other advice. Investing in or trading crypto assets comes with a risk of financial loss.

Nancy J. Allen is a crypto enthusiast, with a major in macroeconomics and minor in business statistics. She believes that cryptocurrencies inspire people to be their own banks, and step aside from traditional monetary exchange systems. She is also intrigued by blockchain technology and its functioning. She frequently researches, and posts content on the top altcoins, their theoretical working principles and technical price predictions.


