
 Home
Home News
News

- 1 BROS stock price has shown a strong consolidation on a larger time frame.
- 2 As of now, the BROS stock price is forming a symmetrical triangle pattern on a weekly time frame.
- 3 As the stock price fell to the demand zone on daily time frame, what seems to be a last correction before a bullish move.
BROS stock price has been trading in a small range from the past week.The stock price has managed to sustain at the demand zone after falling to the demand zone. As of now, the BROS stock price is trading at the price level of $31.41 with -2% drawdown in the latest trading session.

BROS stock price forms a continuation chart pattern
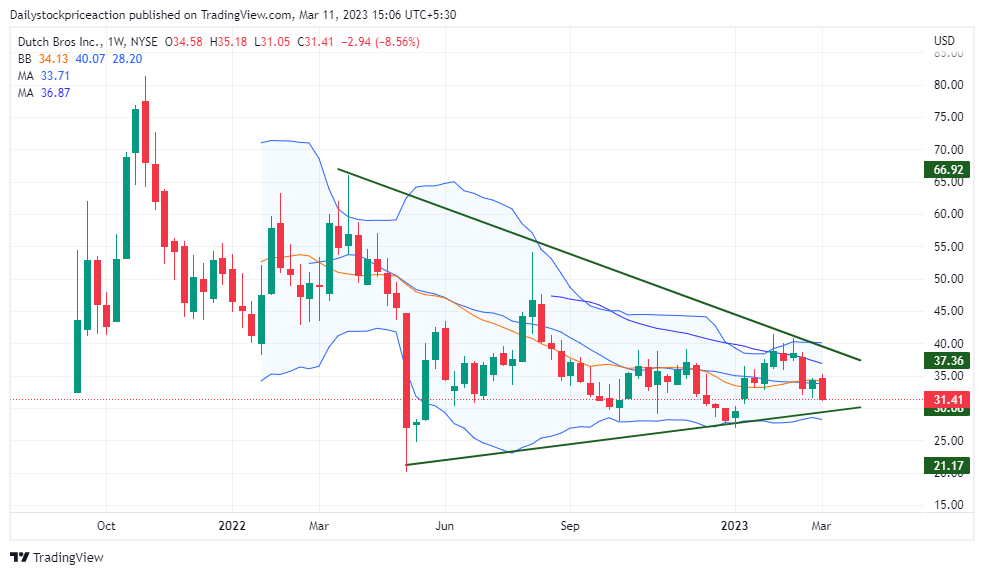
BROS stock price, as per the price action is suggesting a possible bullish momentum in the upcoming trading days after a nominal movement throughout the past 3 weeks.As of now, the BROS stock price is trading below the 25 and 50 moving averages. These MAs were seen acting as a strong supply zone. Although the stock price is trading at the demand zone,it trades at the end of the range indicating a possible breakout on either side.

BROS stock price is transacting at the middle of the bollinger band indicator. This came after the stock price fell to the demand zone failing to surpass the upper band of the indicator. As soon as the stock price fell, the volumes were seen increasing depicting a presence of bears. Investors should expect a massive move on either side in the upcoming trading days.
BROS stock price forms a symmetrical triangle pattern

The RSI curve despite a strong consolidation in the price of BROS stock is seen approaching a halfway mark of 50. Thus indicating a bullish trend in the upcoming trading days. As of now, the RSI curve is transacting at the level of 44.51. Once BROS stock price breaks the supply zone with a strong bullish candlestick, the RSI curve can be seen crossing the halfway mark of 50 supporting the bullish move.
The MACD indicator has triggered a positive crossover way back as the stock price bounced off strongly from the demand zone. The blue line crossed the orange line on the upside and since then the stock price has managed to sustain above the current demand zone. The MACD lines have started falling again as seen previously and if the stock price manages to break the supply zone then the MACD line can be seen widening further supporting the overall trend.
Conclusion: BROS stock price has shown great strength amid a market disruption in the past couple of trading weeks. The technical parameters are suggesting a strong move as the sock price nears breakout. It remains to see if the stock price will rise to a new high or fail to do so and fall.
Support: $27 and $29
Resistance: $42 and $45
Disclaimer
The views and opinions stated by the author, or any people named in this article, are for informational ideas only, and they do not establish financial, investment, or other advice. Investing in or trading crypto assets comes with a risk of financial loss.

Andrew is a blockchain developer who developed his interest in cryptocurrencies while pursuing his post-graduation major in blockchain development. He is a keen observer of details and shares his passion for writing, along with coding. His backend knowledge about blockchain helps him give a unique perspective to his writing skills, and a reliable craft at explaining the concepts such as blockchain programming, languages and token minting. He also frequently shares technical details and performance indicators of ICOs and IDOs.


