
 Home
Home News
News
- 1 Chainlink was currently at $7.12 with an increase of 5.96% during the intraday trading session.
- 2 The 24-hour low of LINK was $6.66 and the 24-hour high of LINK was $7.13.
- 3 The current Chainlink token price is above 20, 50, 100, and 200-Day EMA.
The pair of LINK/BTC was trading at 0.000823 BTC with a dip of 5.18% over the intraday trading session.
After the start of 2023, the LINK coin is moving upwards with the support of buyers breaking its primary support and resistance. This shows that there is heavy buying is happening in the market which also says that the buyers have become hyperactive in 2023. After the token tested its secondary resistance of $8.259 sellers pushed back the coin below its primary resistance of $7.479.
The formation of a bullish hammer candlestick pattern over the daily trading chart. The formation of the bullish hammer candlestick after a downtrend indicates that the token may show a bullish reversal over the daily chart. This indicates that the buyers are coming in the majority and trying to take the market back from sellers.
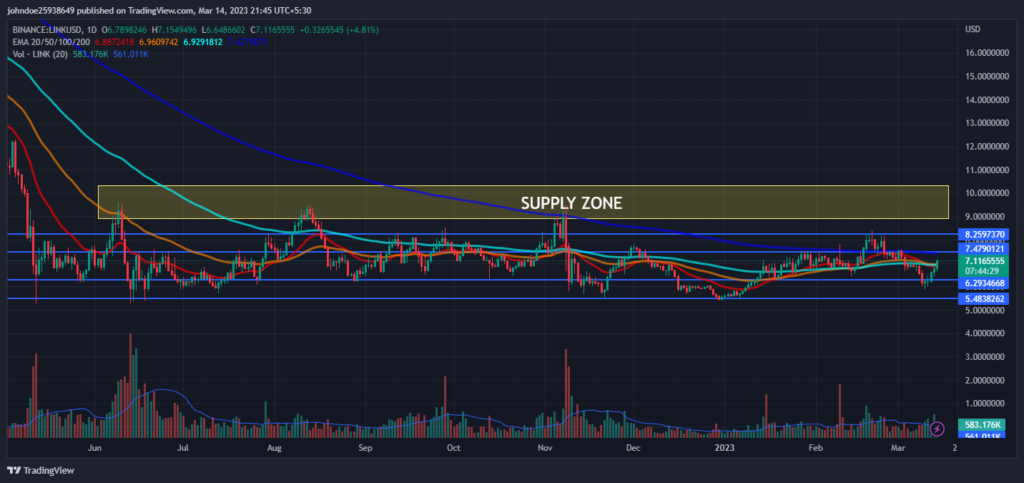
The coin’s volume has increased by 5.41% in the last 24 hours. The increase in volume indicates that the number of buyers has increased. This shows that buyers are trying their best and there is a relationship between volume and the price of LINK, which represents strength in the current bullish phase.
What does the Chainlink Price Technical analysis say?
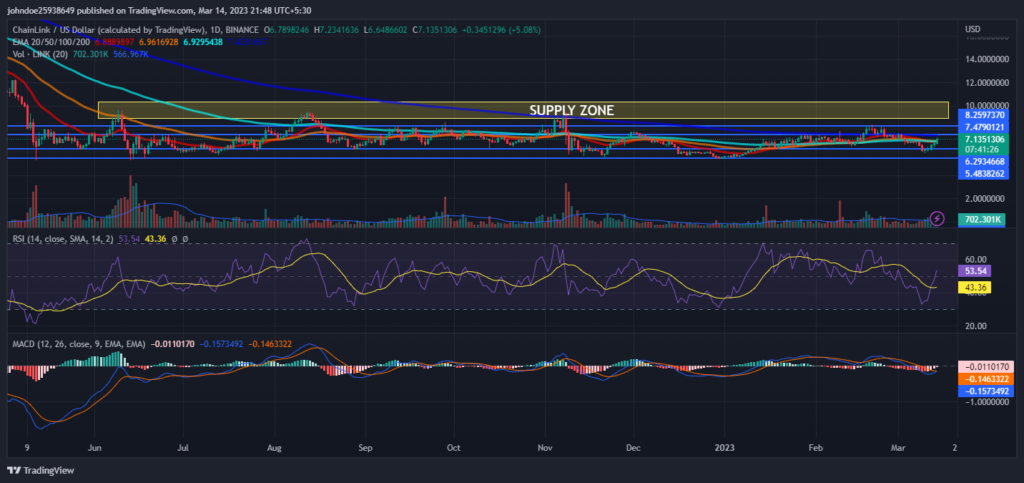
Technical Indicators show that the RSI has increased in the oversold zone and is shown a positive crossover which indicates that the buyers are coming in the majority and pushing LINK upwards. This suggests the strength of the current bullish trend. The current value of RSI is 53.45 which is above the average RSI value of 43.34.
The MACD and the signal line are increasing but not showing any definitive crossover over the daily chart which can support the RSI claims. Investors need to watch every move over the charts during the day’s trading session.
Conclusion
Chainlink price prediction suggests that it is currently in an uptrend after the formation of a bullish hammer candlestick pattern over the daily trading chart. Since the start of 2023, the LINK is trying to get stability in the market with the support of bulls. The increase in volume shows positive market sentiment towards the LINK coin. RSI has increased in the oversold zone and is shown a positive crossover which shows strength in current bullish trend, as per technical indicators. This provide good opportunities for long traders.
Technical Levels-
Resistance level- $7.479 and $8.259
Support level- $6.293 and $5.483
Disclaimer-
The views and opinions stated by the author, or any people named in this article, are for informational purposes only, and they do not establish financial, investment, or other advice. Investing in or trading crypto assets comes with a risk of financial loss.
Steve Anderson is an Australian crypto enthusiast. He is a specialist in management and trading for over 5 years. Steve has worked as a crypto trader, he loves learning about decentralisation, understanding the true potential of the blockchain.


