
 Home
Home News
News

- 1 TRON was currently at $0.06735 with an increase of 1.24% during the intraday trading session.
- 2 The 24-hour low of TRX was $0.0661 and the 24-hour high of TRX was $0.06908.
- 3 The current TRON token price is above 20, 50, 100, and 200-Day EMA.
The pair of TRX/BTC was trading at 0.000002694 BTC with a dip of 1.14% over the intraday trading session.

TRON price prediction suggests that it is currently in an uptrend after breaking its primary resistance of $0.065. The formation of the hammer candlestick pattern after a downtrend may be the cause of the current uptrend. The hammer candlestick is found at the bottom of a downtrend and signals a potential bullish reversal in the market. The long lower shadow of the hammer indicates that the market tested to find where supply and demand were located. When the market found the support area, the lows of the day, bulls began to push prices higher, near the opening price. Thus, the bearish advance downward was rejected by the bulls.

After the start of 2023, the TRON token started trying to seek stability with the help of buyers. On its way upward the TRON token broke its primary support and resistance which indicates that there is heavy buying happening in the market. But as soon as the TRON token reached its secondary resistance of $0.072 sellers again became active in the market pushing the token below its primary resistance of $0.065. This indicates that sellers have positioned themselves at secondary resistance. If buyers are able to break the secondary resistance then the TRON token may enter its supply zone or distribution zone.
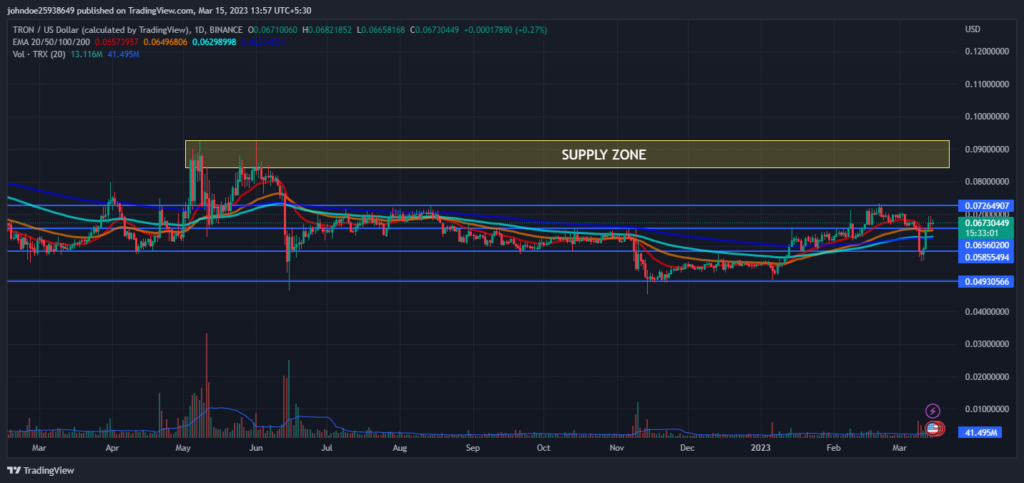
The coin’s volume has increased by 7.39% in the last 24 hours. The increase in volume indicates that the number of buyers has increased. This shows that buyers are trying their best and there is a relationship between volume and the price of TRX, which represents strength in the current bullish phase.
What does the TRON Price Technical analysis say?
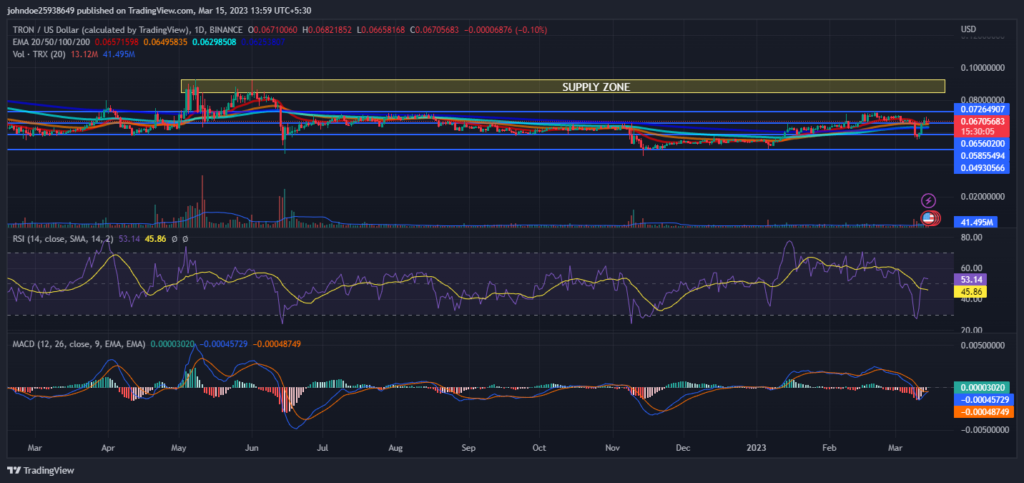
Technical Indicators show that the RSI has increased and entered the overbought zone and is showing a positive crossover which indicates that the buyers are coming in the majority and pushing TRX upwards. This suggests the strength of the current bullish trend. The current value of RSI is 53.43 which is above the average RSI value of 45.88.
The MACD and the signal line are increasing and showing signs of positive crossover over the daily chart. Investors need to watch every move over the charts during the day’s trading session.
Conclusion
The current uptrend of TRON is suggested by its price prediction, which broke its primary resistance level of $0.065. This uptrend may have been triggered by the formation of a hammer candlestick pattern following a downtrend. Since the beginning of 2023, TRON has been attempting to stabilize with the support of buyers. The trading volume has increased, indicating a positive market sentiment toward the TRX token. According to the technical indicators, the RSI has entered the overbought zone and is exhibiting a positive crossover, which indicates strength in the current bullish phase. This presents favorable opportunities for long traders.
Technical Levels-
Resistance level- $4.523 and $6.018
Support level- $3.342 and $2.817
Disclaimer-
The views and opinions stated by the author, or any people named in this article, are for informational purposes only, and they do not establish financial, investment, or other advice. Investing in or trading crypto assets comes with a risk of financial loss.

Nancy J. Allen is a crypto enthusiast, with a major in macroeconomics and minor in business statistics. She believes that cryptocurrencies inspire people to be their own banks, and step aside from traditional monetary exchange systems. She is also intrigued by blockchain technology and its functioning. She frequently researches, and posts content on the top altcoins, their theoretical working principles and technical price predictions.


